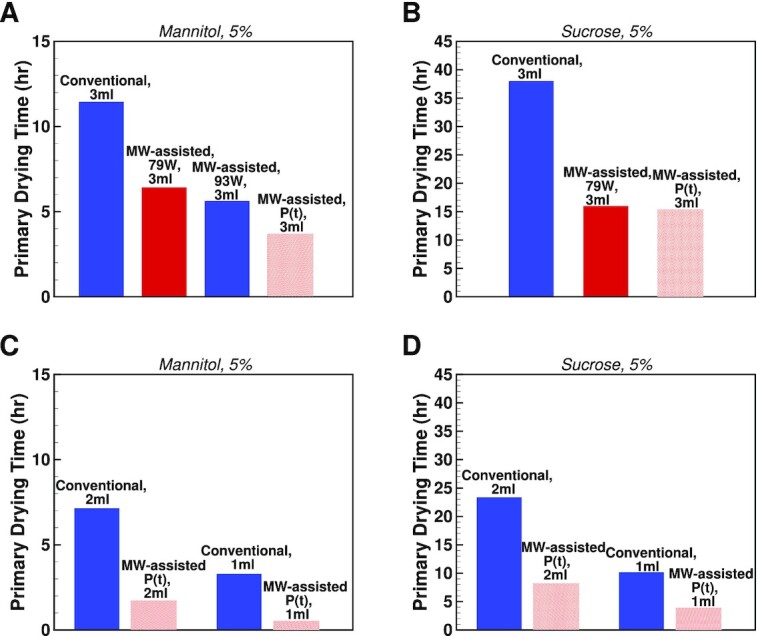
Fig. 8.

Primary drying time for conventional drying (blue bars) and microwave-assisted drying (18 GHz) (red bars). (A) A volume of 3 ml mannitol 5% filled in Schott 6R vials and (B) 3 ml sucrose 5% filled in Schott 6R vials. Conventional and microwave-assisted results in (A) and (B) are based on experimental data. Conventional drying results in (C) and (D) are based on simulation and shown for 1 and 2 ml fill volumes with (C) mannitol 5% and (D) sucrose 5%. All the variable power (P(t)) drying results are obtained from the simulation where critical product temperatures were assumed to be −3°C and −28°C for mannitol and sucrose runs, correspondingly.
