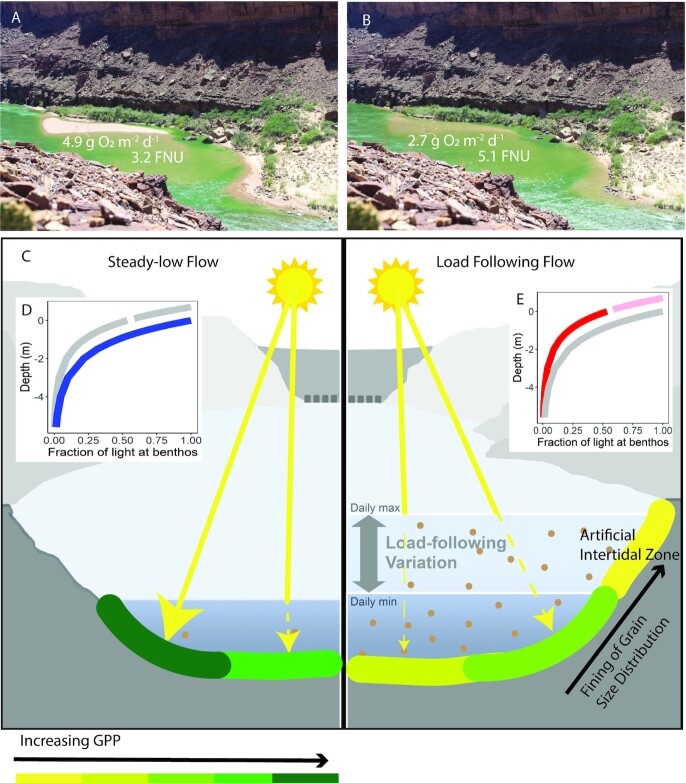
Fig. 1.
Photographs from reach B on 14 May and 16 May 2018 (river kilometer 130) show the steady-low flow (A), and the highest point of the load following flow (B). Specific turbidity and daily GPP for the reach at the time the photograph was taken is noted in white. Panel (C) shows a conceptual model for GPP in the study reaches during times when tributary inputs are low. Less turbidity, less light attenuation, and more primary production are depicted during steady-low flow conditions (left) than during load following flows (right). Finer bed grain size distribution along the river margins (19, 20) together with higher discharge result in more turbidity during load following flows. Inset panels (D) and (E) show the fraction of incident light estimated to reach the benthos from the high-water mark during steady-low (blue) and load following (red and pink) flow where gray shows the contrasting flow response in each panel. Depth indicates meters below (+) or above (-) the steady-low water line, with depths above the steady-low water line (in the artificial intertidal zone) represented in pink on panel (E). The fraction of incident light reaching the benthos was calculated as e−Kaz, where z is water depth and Ka is the light attenuation coefficient assuming a 15º solar angle of incidence and 2,000 PFFD. Ka was estimated at the median turbidity for each flow regime (11.7 FNU, red and 8.3 FNU, blue) using the linear relationship with turbidity in the Colorado River (Figure S5a, Supplementary Material). We hypothesize that GPP in the artificial intertidal zone is low due to high disturbance associated with wetting and drying cycles. Panel (C) modified from Kennedy et al. (9).

