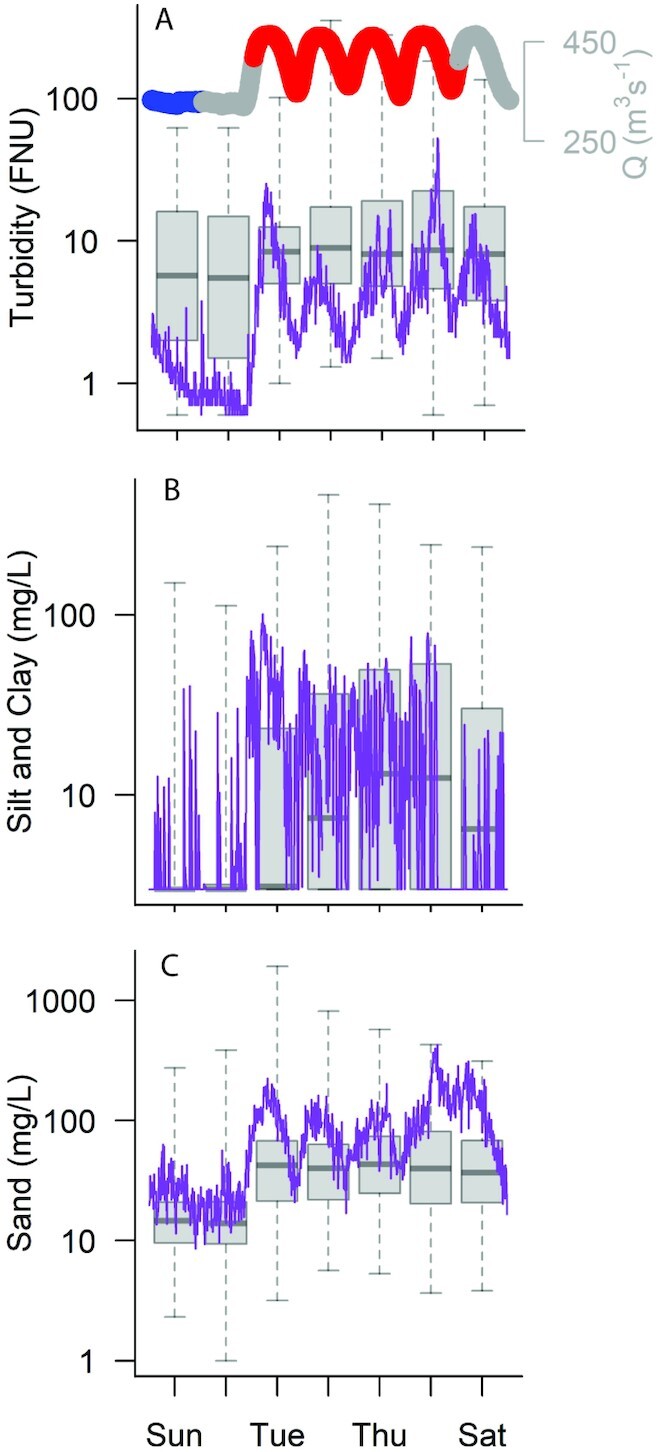
Fig. 2.

Discharge (top line) and turbidity (A), silt-and-clay (B), and sand concentrations (C) plotted in purple during the week of 2018 June 3 at the USGS Colorado River above Little Colorado River near Desert View, AZ, “A” 09383100 gaging station, 120 km below the Glen Canyon Dam. Boxplots show all turbidity (A), silt-and-clay (B), and sand (C) data available for the station during the entire experimental flow study period (May and June of 2018 and 2019). Due to transit time, steady-low flow releases from the Glen Canyon Dam reach this station very early on Sunday morning (∼2:00 MST) and last until Monday evening (∼20:00). For discharge, the modeled steady-low day of discharge is in blue, the modeled “load following” days are in red, and transition days are in gray.
