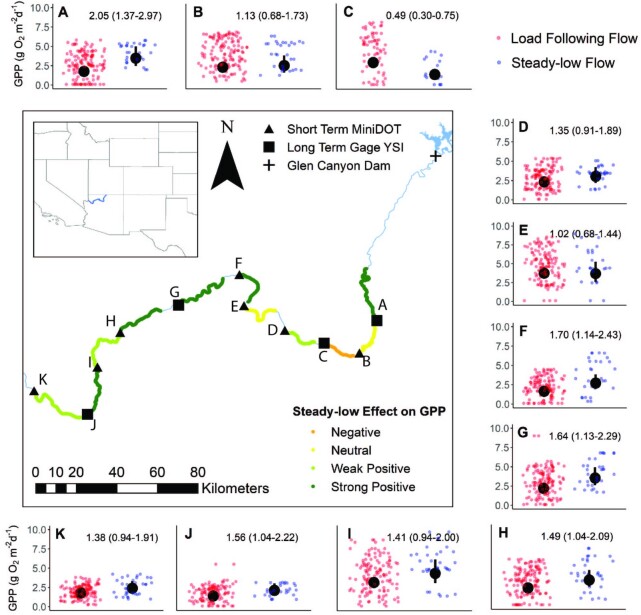
Fig. 3.
Positive (green), neutral (yellow), or negative (orange) response of GPP rates to a shift from load following to steady-low flows in 11 reaches on the Colorado River in May and June of the 2018 and 2019 flow experiment. The length of each modeled reach is estimated based on gas transfer (80% turnover reach). The experiment maintained normal load following flow during the weekdays and adjusted to low and steady flows during the weekends. A total of 8 out of 11 reaches had elevated GPP on the weekend steady-low flow, relative to the weekday load following flow. Daily GPP estimates and modeled flow effects are plotted in separate panels for reaches A–K clockwise from the upper left to lower left. The x-axis separates GPP estimates by flow regime, with red dots representing GPP on days with load following flow and blue dots representing GPP on days with steady-low flow. Additional information about each reach and gaging station is available in the supplementary methods and Table S1 (Supplementary Material). The larger black points and ranges show the estimated median effect of load following vs. steady-low turbidity conditions with 90% credible intervals. Parameter estimates and 90% credible intervals are reported in the upper right corner and approximate the fractional change in GPP from load following to steady-low flows. Strong and weak positive effects were defined for cases where the lower end of the 90% credible interval did not drop below 1 or 0.9, respectively. A negative effect was defined when the upper end of the credible interval did not climb above 0.9, otherwise the effect was considered neutral. Inset map shows the location of the Colorado River reaches modeled here within the southwestern United States.

