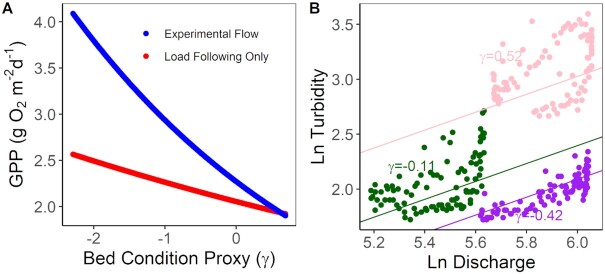
Fig. 4.
Panel (A) shows the average weekly mean GPP across sites A, G and J under differing bed grain size distribution conditions (γ) at a fixed daily mean discharge under experimental flows (blue) vs. load following only (red). The bed condition proxy uses the daily relationship between discharge and turbidity to infer coarser or finer bed grain size distributions (smaller and larger values of γ respectively). Panel (B) shows how daily differences in the y intercept of the ln–ln relationship between Q and turbidity are used to calculate γ. Individual points show 15-min data from a single day, with three different days depicted in three different colors. Here, γ is calculated for the day before the week begins, with lower values for γ indicating a coarser bed grain-size distribution. At γ values > 0.8 the experimental flow effect on GPP is indistinguishable relative to the load following-only scenario.

