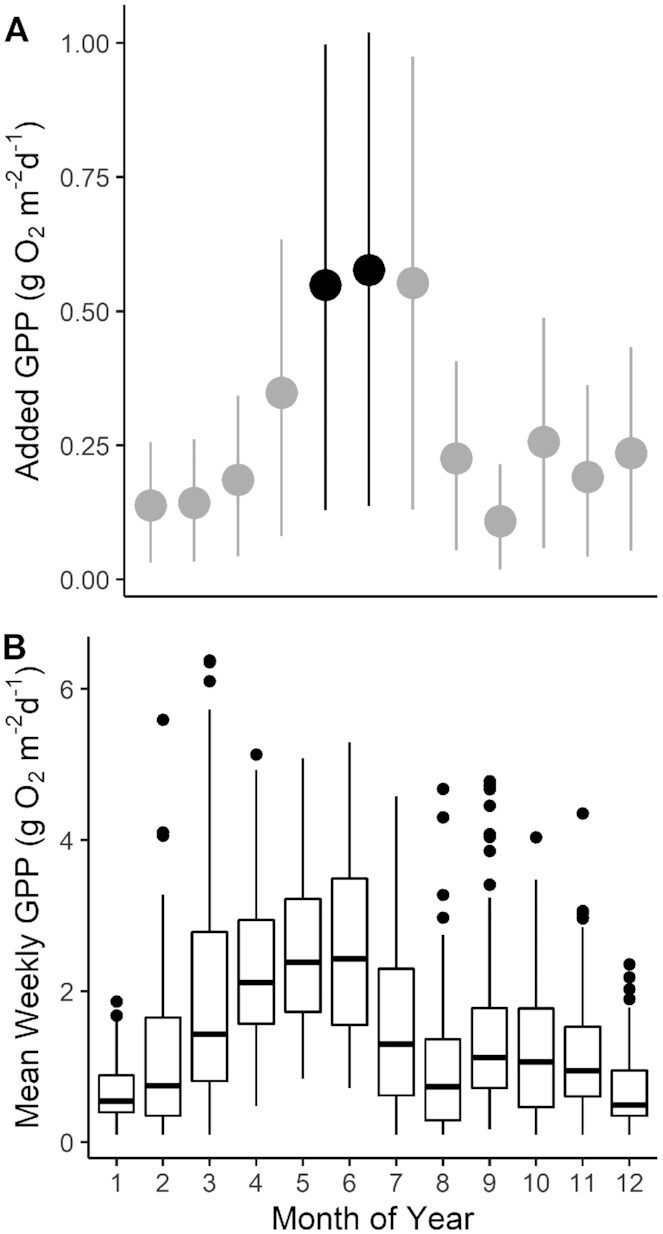
Fig. 5.

The additional weekly rate of GPP expected under the experimental flow regime during each month of the year (A) and the actual observed rates of weekly GPP (B) across 8 years in the three reaches with long-term data (reaches A, G, and J; Table S1, Supplementary Material). Actual observed rates of weekly GPP in panel (B) include 2 years of experimental flows and 6 years with no experimental flows. The experimental flow months examined in this paper are in black, extrapolated effects are in gray. In panel (A), dots indicate the model-averaged differences in the means of the posterior predictive distributions of weekly GPP under experimental vs. load following only flows; error bars indicate the 2.5% and 97.5% quantiles of the difference. In panel (B), the boxes demarcate the 25th and 75th percentiles; the horizontal lines indicate median concentrations; the whiskers extend to the largest value less than 1.5 times the interquartile range, and data extending beyond this range are plotted as individual points.
