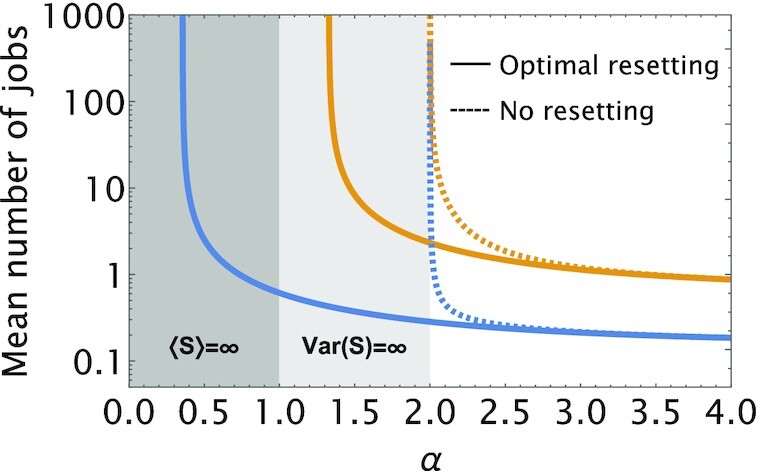
Fig. 8.

Queues with service resetting can operate under extreme heavy-load conditions that are not accessible to normal queues. To illustrate this, we plot in dashed lines the mean number of jobs for two queues with a Pareto service time distribution. Fixing L = 1 in Eq. (31), and setting the arrival rates to λ = 0.125 (blue) and λ = 0.4 (orange), we see that both queues “blow up” as α → 2. Indeed, recalling Eq. (34), we see that Var(S) = ∞ for α ≤ 2 and the divergence in the mean number of jobs follows from the Pollaczek–Khinchin formula. In contrast, we use solid lines to plot the mean number of jobs for the same queues, but with optimal sharp resetting. Observe that in both cases the mean number of jobs remains finite well below α = 2, and only diverges when the service rate (under optimal sharp resetting) drops below the corresponding arrival rate.
