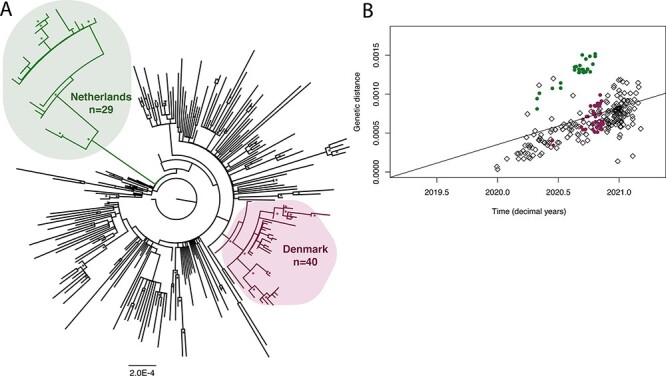
Figure 2.

The phylogenetic analysis of mink-associated SARS-CoV-2 genomes, focusing on two geographical outbreaks from the Netherlands and Denmark. (A) Maximum likelihood tree of SARS-CoV-2 sequences (n = 269). The two mink-associated clades are highlighted in bubbles: the Netherlands clade (n = 29) is highlighted in the upper left corner and Denmark clade (n = 40) in the lower right corner, with the remaining tips representing human isolates (n = 200). The tree is rooted with SARS-CoV-2 reference sequence Wuhan/IVDC-HB-04/EPI_ISL_402120. Bootstrap replicates (n = 1000) >70 per cent are marked with an asterisk. The scale bar represents substitutions per site (subs/site). (B) A root-to-tip regression plot of the genetic distance vs time (in decimal years) of the 269 SARS-CoV-2 genomes used in this analysis. Sequences in the Netherlands group (n = 29) are represented by green dots, and Denmark sequences (n = 40) are represented by purple dots, with the remaining human isolates represented by black diamonds (n = 200).
