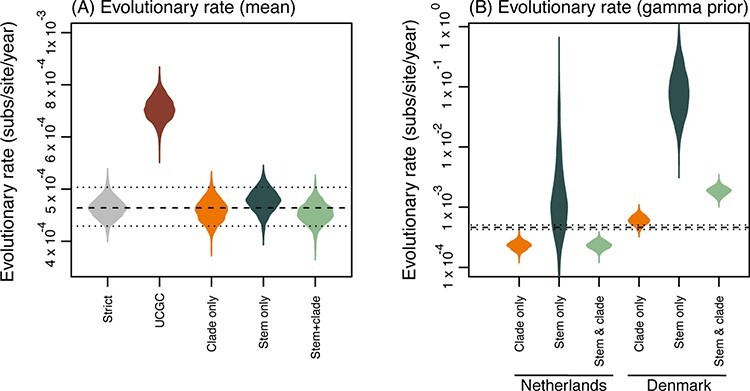
Figure 3.

Violin plots of posterior density for the evolutionary rates (substitutions/site/year). (A) The mean evolutionary rates of each clock model, from left to right: strict clock, uncorrelated gamma distributed (UCGD) relaxed clock, and FLC models: clade only, stem only, and stem and clade. (B) Evolutionary rates estimated from FLC models using a conservative prior on clock rate. From left to right, estimates are shown for the foreground branches for the Netherlands, Denmark, and shared mink models: clade only, stem only, and stem and clade. Dashed lines represent the mean evolutionary rate (and 95 per cent HPD intervals) from the strict clock.
