

Abstract
CD40 signaling in classical type 1 dendritic cells (cDC1s) is required for CD8 T cell-mediated tumor rejection, but the underlying mechanisms are incompletely understood. Here, we identified CD40-induced genes in cDC1s, including Cd70, Tnfsf9, Ptgs2 and Bcl2l1, and examined their contributions to anti-tumor immunity. cDC1-specific inactivation of CD70 and COX-2, and global CD27 inactivation, only partially impaired tumor rejection or tumor-specific CD8 T cell expansion. Loss of 4-1BB, alone or in Cd27−/− mice, did not further impair anti-tumor immunity. However, cDC1-specific CD40 inactivation reduced cDC1 mitochondrial transmembrane potential and increased caspase activation in tumor-draining lymph nodes, reducing migratory cDC1 numbers in vivo. Similar impairments occurred during in vitro antigen presentation by Cd40−/− cDC1s to CD8+ T cells, which were reversed by re-expression of Bcl2l1. Thus, CD40 signaling in cDC1s not only induces costimulatory ligands for CD8+ T cells but also induces Bcl2l1 that sustains cDC1 survival during priming of anti-tumor responses.
Recognition that cytolytic T cell (CTL) responses rely on help from other T cells began in the 1970s, but the underlying mechanisms are still actively studied. Help for CTL responses was first reported in 1975, based on in vivo ‘helper cell’ depletion using antibodies specific for the Ly-1 surface marker1. CD40 was discovered in the context of B cell proliferation2, and its ligand3 (CD40L) expressed by CD4 T cells was subsequently recognized to deliver help for B cells in antibody production4,5. Later, CD4 T cell help for CD8 T cell responses was also attributed to CD40L-dependent ‘licensing’ of antigen-presenting cells (APCs)6–8. Alternate suggestions that CD4 T cells directly activate CD40 signaling in CD8 T cells9 were excluded by subsequent studies10,11. In vitro analysis12 and intravital imaging13,14 suggested that the relevant target of CD4 help for CTL responses is the cDC1 (classical type 1 dendritic cell) subset, which is uniquely responsible priming CD8 T cells to tumors15,16, but did not demonstrate the involvement of CD40 signaling in vivo.
Mice were recently generated with conditional inactivation of major histocompatibility complex class II (MHC-II) and CD40 in cDC1s based on an Xcr1Cre deleter strain17. These results showed that cDC1 can prime both CD4 and CD8 T cells and also confirmed that cDC1s directly receive CD40 signaling in vivo through cognate interactions with CD4 T cells. However, the precise mechanism by which CD40 signaling in cDC1s licenses the effective activation of tumor-specific CTL responses remains undefined.
CD40 signaling in B cells is also induced by cognate interaction with CD4 T cells expressing CD40L and is important for germinal center (GC) formation18, class-switch recombination and secondary antigen-specific response19,20 and affinity maturation21. These CD40L-dependent functions of B cells involve the signaling molecules TRAF2, TRAF6, MEKK1, m-TOR, Jnk and p38 and the c-Jun transcription factor21–23. Downstream gene targets induced by CD40 signaling in B cells include the transcription factors Bcl6, Irf4, Rel, Rela and Myc24. However, these genes are also expressed in follicular B cells, thus making it difficult to determine how much their induction by CD40 signaling contributes to processes in the GC reaction24.
So far, there has been no systematic identification of the target genes downstream of CD40 signaling in cDC1. CD70 has been proposed as the critical target of CD40 signaling responsible for licensing CTL responses25,26. CD40 and CD70 are not expressed by immature classical dendritic cells (cDCs), but become induced after homeostatic or TLR-driven activation27,28. Studies examining the role of CD70 in vivo have relied either on antibody blockade25,26 or used mice with germline deficiencies in CD70 or CD27, the CD70 receptor29,30. Unfortunately, these approaches do not necessarily indicate that the observed effects are due to the actions of CD70 expressed by cDC1s. To address this issue, one study transferred cDCs generated from wild-type (WT) or Cd70−/− bone marrow (BM) into recipient mice harboring OT-1 T cells, finding a reduction in OT-I proliferation in the absence of CD70 expression31. Another study used mixed chimeras, generated from Batf3−/− and Cd70−/− BM, to show that CD70 expression by cDC1 can support CD8 T cell proliferation32. However, no study has tested the in vivo requirement for cDC1-specific CD70 expression in generation of helper-dependent anti-tumor immunity.
Here, we identified genes highly induced in cDC1s by CD40 signaling using an unbiased approach. CD70 was among the most highly induced genes, which also included 4-1BB ligand, Ptgs2 and Bcl2l1. We examined the effect of conditional CD70 deletion in cDC1s by generating a new Cd70 floxed allele, finding only a partial reduction in anti-tumor immunity. Our results showed that other gene targets downstream of CD40 signaling, including COX-2, and Bcl-xL, also contribute to the CD40-dependent augmentation of CTL responses. In particular, beyond induction of costimulatory ligands, CD40 signaling appears to promote enhanced cDC1 survival during the process of antigen presentation by reducing caspase activation and apoptosis.
Results
CD40 signaling highly induces Cd70, Tnfrsf9, Ptgs2 and Bcl2l1 in cDC1s
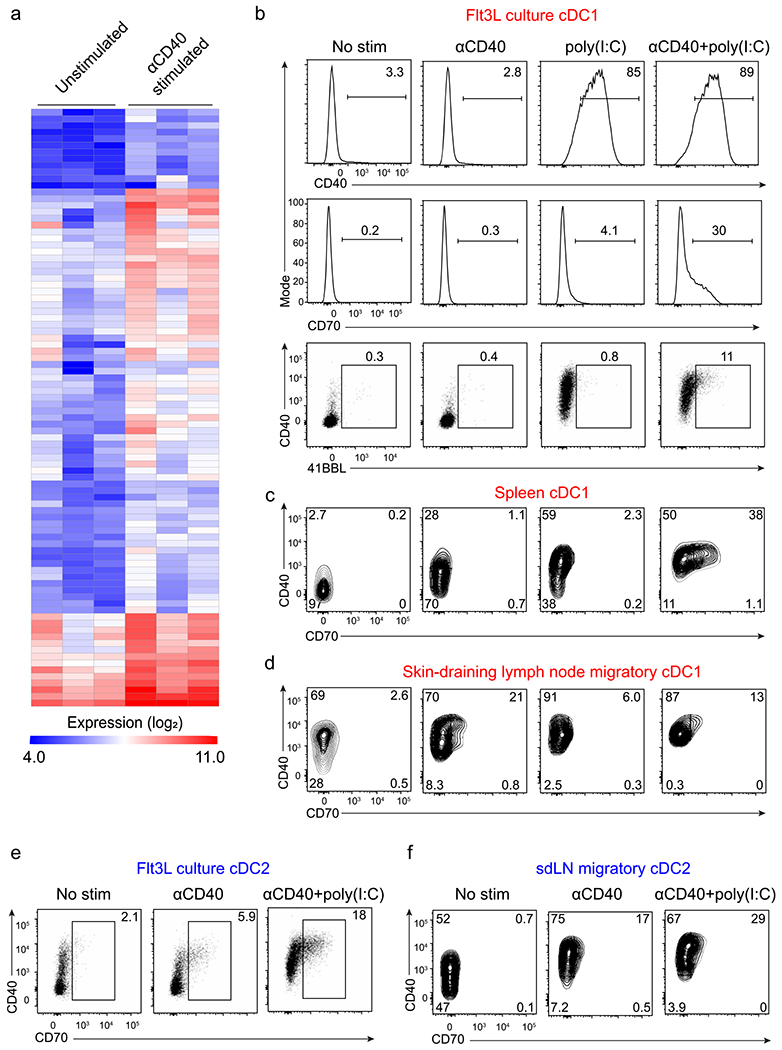
To identify the targets of CD40 signaling in cDC1s that could contribute to enhancing CD8 T cell responses, we performed transcriptional analysis of cDC1s in the presence or absence of agonistic CD40 antibody (Fig. 1). We selected migratory cDC1 from skin-draining lymph nodes (SDLNs), because this population, but not cDC1 from FMS-like tyrosine kinase 3 ligand (Flt3L) cultures, spleen or SDLN resident cDC1, express high levels of CD40 at homeostasis (Fig. 1a). We compared gene expression in untreated or anti-CD40-treated migratory cDC1s after 24-h stimulation (Fig. 1b and Extended Data Fig. 1a). CD40 signaling induced a small set of genes, with fewer than 20 genes induced more than threefold. The two most highly induced genes were Cd70 and Tnfsf9, encoding CD70 and 4-1BBL, ligands for CD27 and 4-1BB, which were induced by around tenfold compared to untreated cDC1s. CD27 and 4-1BB are both members of the tumor necrosis factor (TNF) receptor superfamily and have been shown to provide costimulatory activity to T cells. Cd82, encoding a membrane scaffold tetraspanin; Ptgs2, encoding COX-2; and Bcl2l1, encoding Bcl-xL and Bcl-xS, were also highly induced. We confirmed the induction of CD70 and 4-1BBL using CD40 stimulation in cDC1s isolated from Flt3L-treated BM cultures, spleen and SDLNs (Extended Data Fig. 1b–d). In these cultures, CD70 and 4-1BBL induction required poly(I:C) pretreatment to induce CD40 expression, as expected (Extended Data Fig. 1b). CD40 stimulation also induced CD70 on classical type 2 dendritic cells (cDC2s) (Extended Data Fig. 1e,f).
Fig. 1 |. Transcriptional targets of CD40 signaling in cDC1s.
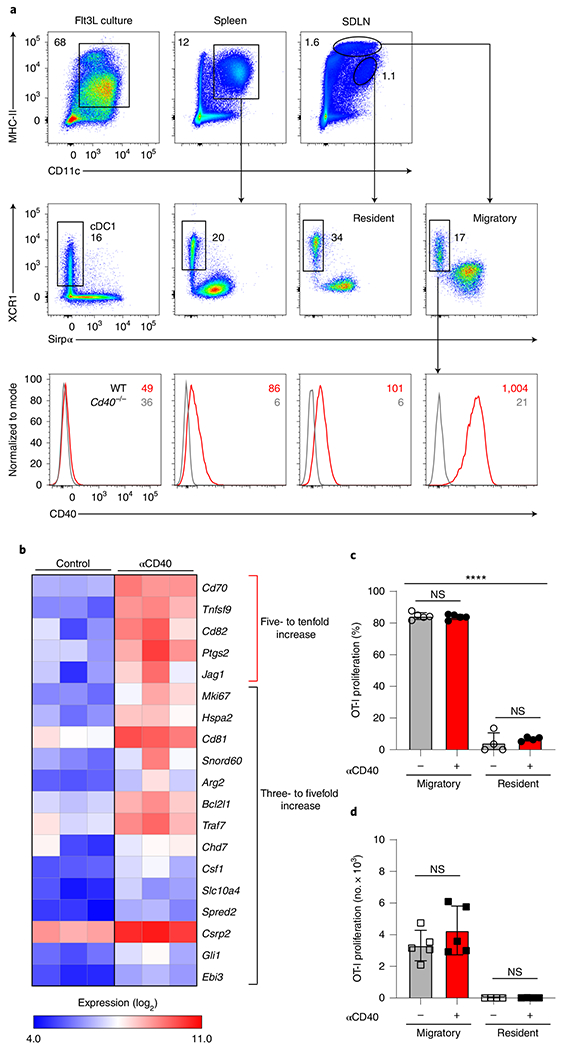
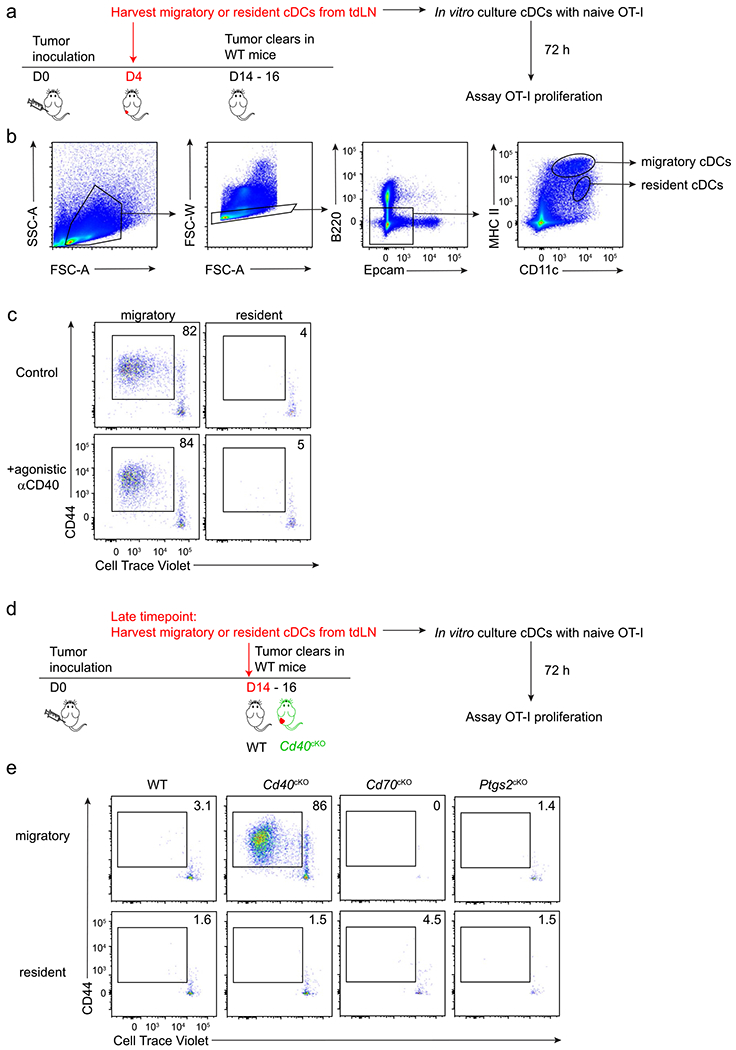
a, Representative flow histograms of CD40 expression in homeostatic XCR1+ cDC1 from Flt3L-treated BM cultures, spleens and SDLNs of WT (Cd40+/+, red) and Cd40−/− mice (gray). BM cells are pregated as B220− Siglec H−, spleen cells as B220− F4/80−, and SDLN cells as B220− CD326−. In top and middle panels, black numbers indicate the percentage of cells in the indicated gates; in the bottom panel, red and gray numbers indicate geometric mean fluorescence intensity (MFI) for CD40 expression in cells from WT and Cd40−/− mice, respectively (representing three independent experiments, n = 3 mice). b, Log2 expression of genes with the highest fold increase (at least threefold) between SDLN cDC1s treated in the presence or absence of agonistic αCD40 mAb (results averaged from three independent experiments). c,d, Percentages (c) and number (d) of proliferated OT-I CD8 T cells cultured with migratory or resident cDCs sorted from tumor-draining lymph nodes (TDLNs) of B6 WT tumor-bearing mice in the presence (red) or absence (gray) of agonistic CD40 antibody for 72 h. Data represent replicates from two biologically independent experiments (n = 5 for migratory and n = 4 for resident cDCs). Data are represented as mean values ± standard deviation (s.d.). ****P < 0.0001; NS, not significant. c,d, Brown–Forsythe and Welch analysis of variance (ANOVA) with Dunnett’s T3 multiple comparisons test.
We previously reported that migratory, but not resident, cDCs in tumor draining lymph nodes (TDLNs) were responsible for presentation of tumor-derived antigens to T cells33. To test whether CD40-mediated help could enhance the capacity of resident cDCs for presentation of tumor antigen, we repeated our previous analysis, now comparing antigen presentation in the presence or absence of CD40 stimulation (Fig. 1c,d and Extended Data Fig. 2). Again, we found resident cDCs from TDLNs from mice harboring ovalbumin (OVA)-expressing 1956-mOVA fibrosarcoma to be inactive in stimulation OT-I T cells without CD40 stimulation, similar to our previous report33. Furthermore, additional CD40 stimulation did not rescue the ability of resident cDCs to present tumor-derived antigens to OT-I T cells (Fig. 1c,d and Extended Data Fig. 2c). These results validate our choice to identify relevant CD40 gene targets using migratory cDC1s from tumor-bearing mice.
CD70 induction in cDC1s contributes to CD40-dependent tumor responses
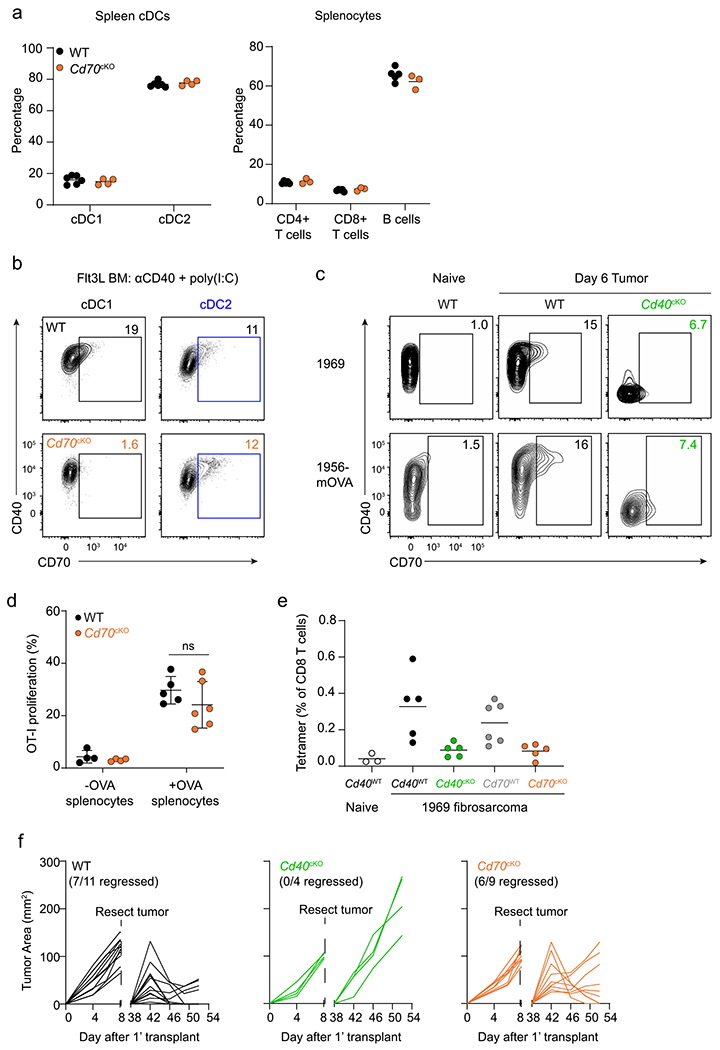
The CD70–CD27 axis has been suggested to mediate the majority of the effect of CD40 signaling on enhancing CD8 T cell responses26. However, previous studies used CD70-blocking antibodies or mice with germline CD70 deficiency, preventing identification of CD70’s site of action. Therefore, we generated a new conditional Cd70 allele harboring loxP sites flanking exon 1 using CRISPR-Cas9 targeting (Fig. 2a). Crossing this Cd70fl allele with our Xcr1Cre deleter strain17 allowed for cDC1-specific deletion of CD70 expression (Cd70cKO mice) but, importantly, did not alter the normal development of cDCs (Fig. 2b and Extended Data Fig. 3a,b).
Fig. 2 |. CD70 expression in cDC1s partially contributes to CD40-dependent responses to tumors.
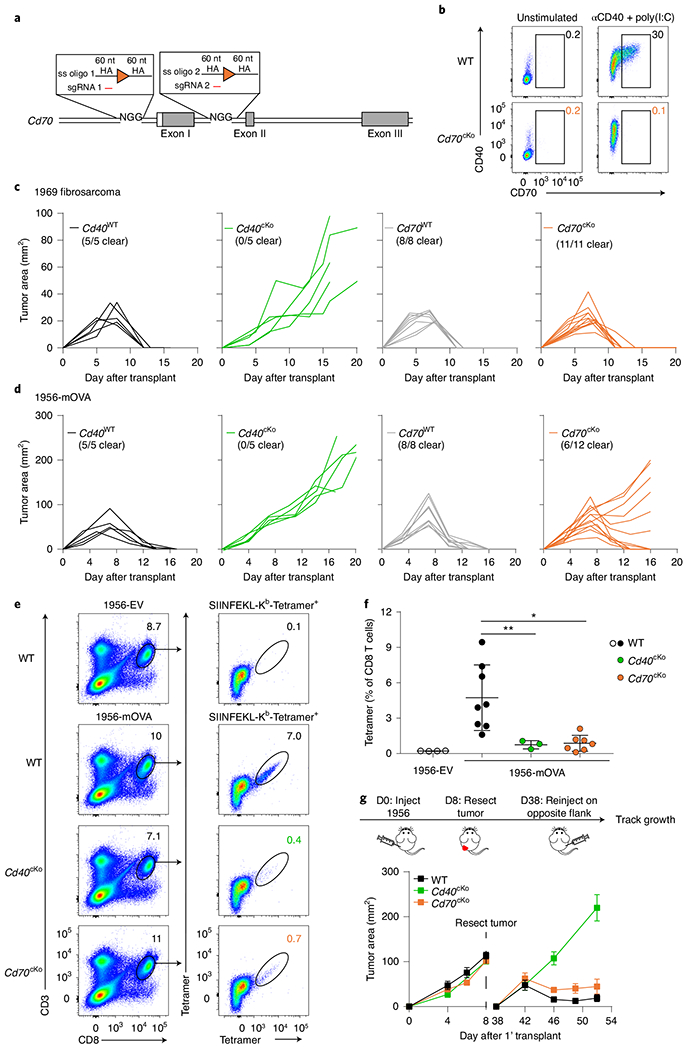
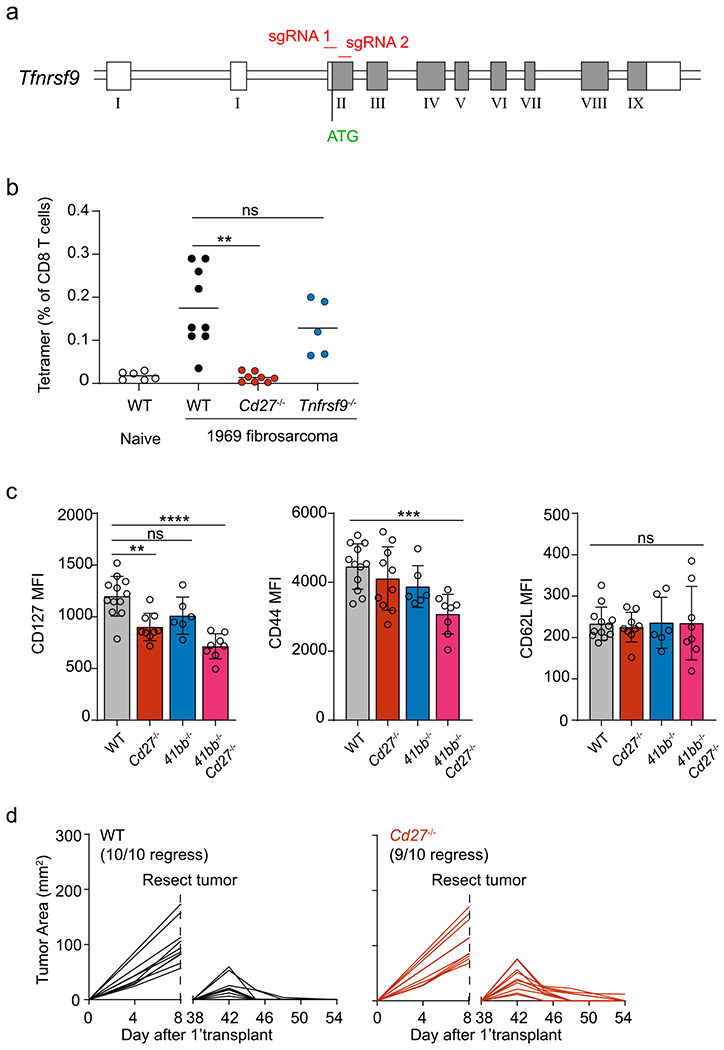
a, Schematic diagram of the mouse Cd70 allele targeted simultaneously by two CRISPR gRNAs and two single-stranded (ss) oligomers to generate a Cd70 conditional knockout allele. Filled and open boxes denote coding and noncoding exons of Cd70, respectively. HA, homology arm. b, Representative flow plots depicting CD70 and CD40 expression in cDC1s from Flt3L-treated BM cultures of WT (Xcr1+/+ Cd70fl/fl, top) and Cd70cKO (Xcr1Cre/+ Cd70fl/fl, bottom) mice, untreated (left) or treated with agonistic CD40 antibody + poly(I:C) (right). c, Tumor growth curves of Cd40WT (Xcr1+/+ Cd40fl/fl, Cd40cKO (Xcr1Cre/+ Cd40fl/fl, green), Cd70WT (Xcr1+/+Cd70fl/fl, gray) and Cd70cKO (Xcr1Cre/+ Cd70fl/fl, orange) mice (left to right) injected subcutaneously with 2 × 10⁶ 1969 fibrosarcoma cells. d, Tumor growth curves of Cd40WT, Cd40cKO (green) Cd70WT (gray) and Cd70cKO (orange) mice (left to right) injected subcutaneously with 106 1956-mOVA cells. e,f, WT (Xcr1+/+Cd70fl/fl), Cd40cKO and Cd70cKO mice were injected with 106 1956-EV or 1956-mOVA cells, and spleens were stained for the presence of SIINFEKL-Kb tetramer+ CD8 T cells on day 10. e, Representative flow plots of percentages of tetramer+ CD8 T cells. f, Quantification of data in panel e depicting tetramer+ CD8+ T cells as a percentage of all CD8 T cells. Data represent pooled biologically independent samples from three independent experiments (n = 4 for WT 1956-EV, n = 8 for WT, n = 3 for Cd40cKO and n = 7 for Cd70cKO mice). Data are represented as mean values ± s.d. *P = 0.0101; **P = 0.0080. g, Top panel shows a schematic diagram of tumor implantation to assess anti-tumor memory. Bottom panel shows tumor growth curves of WT (Xcr1+/+Cd70fl/fl), Cd40cKO and Cd70cKO mice during the primary (1') and secondary implantation of 1956 progressor tumors. Data represent mean ± standard error of the mean (s.e.m.) of pooled biologically independent samples from three independent experiments (n = 11 for WT, n = 4 for Cd40cKO and n = 9 for Cd70cKO). D, day. f, Brown–Forsythe and Welch ANOVA with Dunnett’s T3 multiple comparisons test.
We previously described that rejection of immunogenic fibrosarcomas required CD40 signaling in cDC1s provided by cognate CD4 T cell help17. To determine the contribution of CD70 induction on cDC1s to tumor rejection, we compared tumor growth in WT and Cd70cKO mice (Fig. 2c,d). As a control, we also evaluated tumor rejection in mice with cDC1-specific deletion of CD40 (Cd40cKO mice), as previously described17. Rejection of both the 1969 fibrosarcoma and the 1956-OVA fibrosarcoma17 absolutely required CD40 expression by cDC1s (Fig. 2c,d), consistent with our previous report17. In contrast, rejection of the 1969 fibrosarcoma was not impaired in the absence of CD70 induction on cDC1s, and rejection of 1956-OVA was only partially impaired (Fig. 2c,d). For both tumors, CD70 was induced on cDC1s in TDLNs in WT mice, but not in Cd40cKO mice (Extended Data Fig. 3c), suggesting engagement of CD40 on cDC1 by CD4 T cells. In summary, loss of CD40 on cDC1 causes a much greater impairment of anti-tumor responses compared with loss of CD70.
We evaluated the effect of CD70 on CD8 T cell expansion at early and late times after antigen encounter (Fig. 2e,f and Extended Data Fig. 2d,e). Expansion of tumor-specific T cells cannot yet be observed using MHC class I (MHC-I) tetramers at 3 days after tumor inoculation. Therefore, to examine CD8 T cell expansion at an early time point, we analyzed OT-1 proliferation using Cell Trace Violet (CTV) dilution in WT and Cd70cKO mice 3 days after intravenous (i.v.) immunization with MHC-I-deficient OVA-loaded splenocytes (Extended Data Fig. 3d). We found that OT-I proliferation was not impaired in the absence of CD70 expression by cDC1s. Expansion of endogenous tumor-specific T cells can be observed using MHC-I tetramers on 7–10 days after tumor inoculation (Fig. 2e,f and Extended Data Fig. 3e). At this time, WT mice had a robust expansion of OVA-specific T cells, whereas both Cd40cKO and Cd70cKO mice had severely reduced amounts of OVA-specific T cells. The signal for MHC-I tetramers in Cd40cKO and Cd70cKO mice is reduced to nearly background levels, preventing any conclusions about whether CD8 T cell expansion in Cd70cKO mice is greater or equal to expansion in Cd40cKO mice.
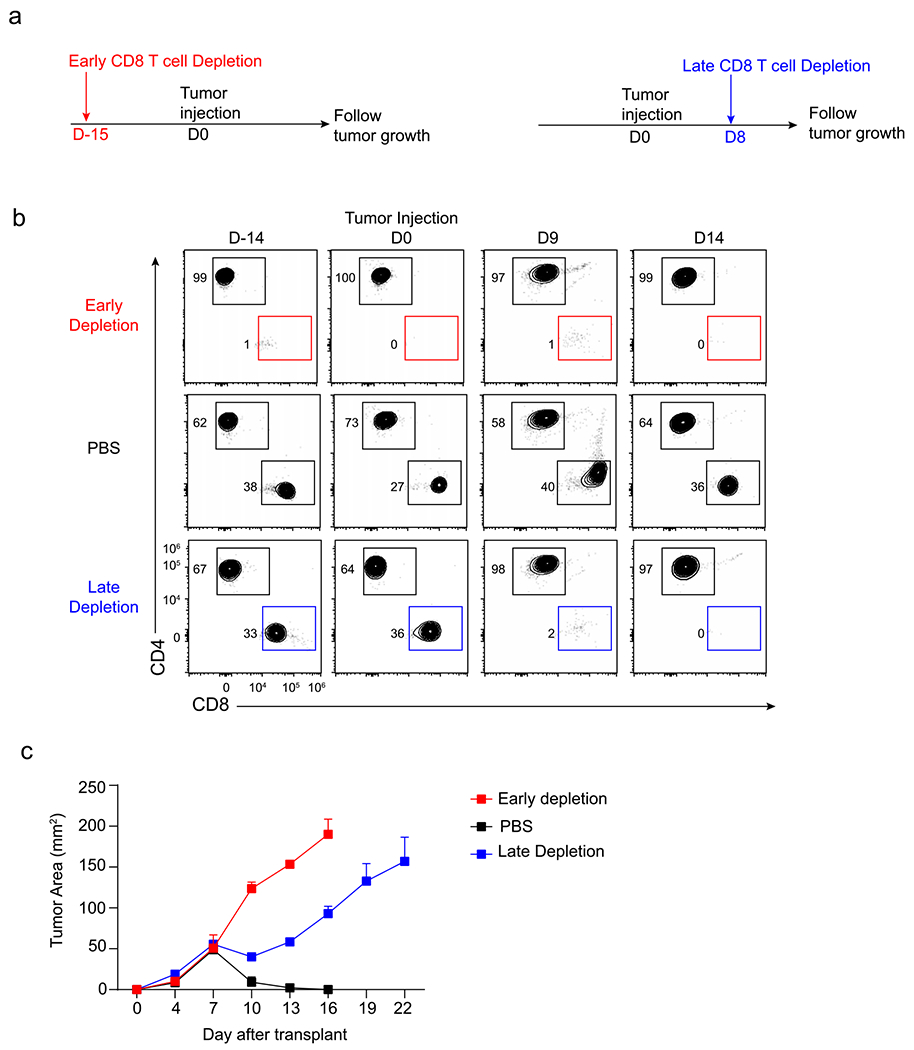
The results above suggest that CD8 T cell responses might be initiated in Cd70cKO mice, despite our inability to document their early expansion using SIINFEKL MHC-I tetramers. Because tumor rejection can require up 16 days to become complete, we attempted to compare the early and late contributions of CD8 T cells to tumor rejection. We compared tumor growth in mice that underwent early versus late CD8 T cell depletion (Extended Data Fig. 4). We found that early CD8 T cell depletion led to continuous tumor growth, whereas late CD8 T cell depletion allowed temporary tumor control, with tumor outgrowth occurring only later. These results emphasize that the actions of tumor control by early responses still remain dependent on continued CD8 T cell control of tumor growth after day 8.
The reduced magnitude of tumor-specific CD8 T cells seen on day 10 could suggest that Cd70cKO mice may have a defect in the formation of T cell memory. To test whether CD70 was required for T cell memory, we used the 1956 fibrosarcoma33, a progressor tumor that induces protective CD8 T cell memory after surgical resection17. Previously we reported that memory formation to 1956 requires CD4 and CD8 T cells as well as CD40 expression by cDC1s. In agreement, here, we show that WT mice, but not Cd40cKO mice, acquire memory that can mediate 1956 tumor rejection (Fig. 2g and Extended Data Fig. 3f). However, Cd70cKO mice also formed memory capable of 1956 tumor rejection. In summary, CD40 expression by cDC1s is absolutely required for expansion of antigen-specific T cells, rejection of several different fibrosarcomas and formation of immunological memory. By contrast, CD70, which is induced by CD40 signaling in cDC1s, regulates the magnitude of T cell expansion against tumors but is not absolutely required for tumor rejection or immunological memory against tumors. Unlike previous studies based on antibody blockade or germline deletion, the results based on cDC1-specific CD70 deletion do not support a “critical” role for CD70 in mediating CD40 help but indicate that CD70 provides only a partial component of CD40 help in these tumor systems.
Costimulatory CD27 and 4-1BB signaling do not fully mediate CD40 help
4-1BBL is one candidate for cooperating with CD70. Like CD70, it is highly induced by CD40 stimulation on cDC1. Also, 4-1BBL is a ligand for 4-1BB encoded by Tnfrsf9, which, like CD27, is a TNF receptor family member expressed on both naive and activated CD8 T cells. We generated a new model of germline deficiency in 4-1BB expression (Tnfrsf9−/− mice) using CRISPR-Cas9 editing (Extended Data Fig. 5a) and confirmed the loss of 4-1BB expression on activated CD8 T cells (Fig. 3b). We next evaluated the contribution of CD27 and 4-1BB to tumor rejection by comparing tumor growth in WT, Cd27−/−, Tnfrsf9−/− and double-deficient Cd27−/− Tnfrsf9−/− mice (DKO mice). In agreement with the partial impairment in Cd740cKO mice (Fig. 2c,d), we also found a partial impairment of tumor rejection of in Cd27−/− mice for both the 1969 and 1956-OVA fibrosarcomas (Fig. 3a,c). By contrast, Tnfrsf9−/− mice showed no impairment of tumor rejection for either 1969 and 1956-OVA fibrosarcomas. Further, the loss of both CD27 and 4-1BB in Cd27−/− Tnfrsf9−/− mice did not further impair tumor rejection beyond the impairment seen in singly deficient Cd27−/− mice (Fig. 3c). These results suggest that the 4-1BBL/4-1BB axis, unlike the CD70-CD27 axis, is not a major contributor to CD40-dependent cDC1 licensing.
Fig. 3 |. Costimulatory CD27 and 4-1BB signaling do not fully mediate CD40 help.
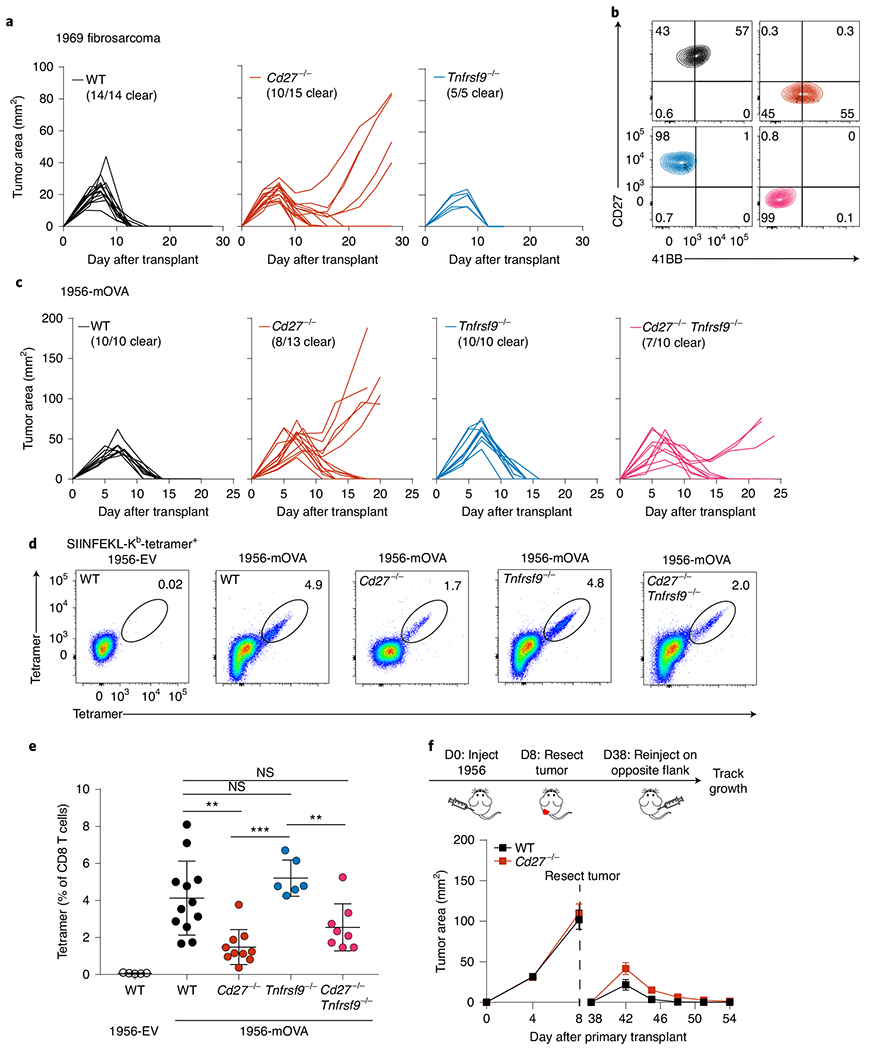
a, Tumor growth curves of WT (Cd27+/+Tnfrsf9+/+), Cd27−/−, and Tnfrsf9−/− mice (left to right) injected with 2 × 10⁶ 1969 fibrosarcoma cells. b, Representative flow plots depicting CD27 and 4-1BB surface expression of splenic CD8 T cells from WT (black), Cd27−/− (red), Tnfrsf9−/− (blue), and Cd27−/−Tnfrsf9−/− (pink) mice stimulated in vitro with αCD3 and αCD28. c, Tumor growth curves of WT, Cd27−/−, Tnfrsf9−/−, and Cd27−/−Tnfrsf9−/− mice (left to right) injected with 106 1956-mOVA cells. d,e, WT, Cd27−/− (red), Tnfrsf9−/− (blue) and Cd27−/−Tnfrsf9−/− (pink) mice were injected subcutaneously with 106 1956-EV or 1956-mOVA cells, and spleens were stained for the presence of SIINFEKL-Kb tetramer+ CD8 T cells on day 10. d, Representative flow plots of percentages of tetramer+ CD8 T cells. e, Quantification of data in panel d depicting tetramer+ cells as a percentage of all CD8 T cells. Data represent pooled biologically independent samples from five independent experiments (n = 5 for WT 1956-EV, n = 12 for WT, n = 10 for Cd27−/−, n = 6 for Tnfrsf9−/− and n = 8 for Cd27−/−Tnfrsf9−/− mice). Data are represented as mean values ± s.d. **P = 0.0026, WT versus Cd27−/− ***P = 0.0001; **P = 0.0046, Cd27−/−Tnfrsf9− versus Tnfrsf9−/; NS, not significant. f, Top panel shows a schematic diagram of tumor implantation to assess anti-tumor memory. Bottom panels shows tumor growth curves of WT (Cd27+/+) and Cd27−/− (red) mice during the primary and secondary implantation of 1956 progressor tumors. Data represent mean ± s.e.m. of pooled biologically independent samples from three independent experiments (n = 10 for WT and n = 10 for Cd27−/− mice). D, day. e, Brown–Forsythe and Welch ANOVA with Dunnett’s T3 multiple comparisons test.
We also evaluated the contribution of CD27 and 4-1BB to the expansion of endogenous tumor-specific CD8 T cells (Fig. 3d,e, and Extended Data Fig. 5b). Loss of CD27 expression reduced expansion of tumor-specific T cells, in agreement with a similar reduction in Cd70cKO mice. Loss of 4-1BB expression did not reduce the expansion of tumor-specific T cells in Tnfrsf9−/− mice or cause a further reduction in Cd27−/− Tnfrsf9−/− mice (Fig. 3d,e and Extended Data Fig. 4b). Despite having a partial impairment of anti-tumor responses, Cd27−/− mice showed no impairment of anti-tumor memory against the progressor 1956 fibrosarcoma (Fig. 3f and Extended Data Fig. 5d). The level of expression of the memory precursor marker CD127 (IL-7Rα) was only marginally reduced in Cd27−/− mice and only 50% reduced in Cd27−/− Tnfrsf9−/− mice, with no reduction in CD62L expression (Extended Data Fig. 5c). In summary, the CD70–CD27 axis represents one component of the CD40-dependent licensing of cDC1s for anti-tumor responses, whereas the 4-1BBL/4-1BB axis appears less critical. This suggests that other CD40-induced targets in cDC1 are necessary to manifest the complete effect of cDC1 licensing.
Ptgs2 induction in cDC1s contributes to CD8+ T cell expansion
Another gene highly induced by CD40 signaling in cDC1 was Ptgs2, which encodes cyclooxygenase 2 (COX-2). COX-2 expression by tumors can suppress anti-tumor immunity34, but its in vivo function in dendritic cells (DCs) for immune regulation is unknown. To evaluate a potential contribution to CD40-dependent enhancement of anti-tumor responses, we crossed the Ptgs2fl/fl mice35 onto the Xcr1Cre background to produce mice selectively lacking COX-2 expression in cDC1 (Ptgs2cKO) (Fig. 4). These mice showed no impairment of tumor rejection for the 1956-OVA fibrosarcoma but showed a mild reduction in the number endogenous tumor-specific T cells (Fig. 4a,b). In addition, these mice were able to form protective memory against the 1956 fibrosarcoma (Fig. 4c), unlike Cd40cKO mice (Fig. 2g). These results show that COX-2, similar to CD70, provides only partial contribution to CD40 help in anti-tumor responses.
Fig. 4 |. Ptgs2 signaling in cDC1s contributes to CD8+ T cell expansion, but not tumor rejection.
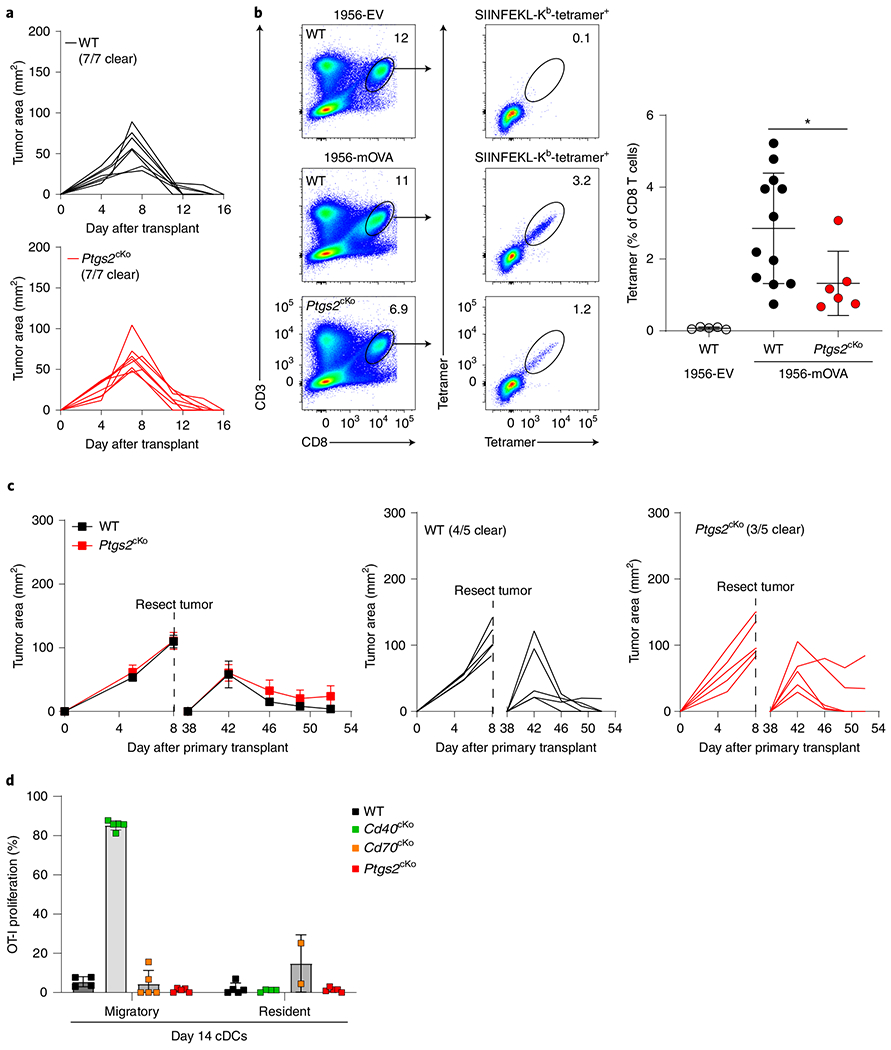
a, Tumor growth curves of WT Xcr1+/+ Ptgs2fl/fl, top) and Ptgs2cKO (Xcr1Cre/+ Ptgs2fl/fl, bottom, red) injected with 106 1956-mOVA cells. b, WT and Ptgs2cKO mice were injected with 106 1956-EV or 1956-mOVA cells, and spleens were stained for the presence of SIINFEKL-Kb tetramer+ CD8 T cells on day 10. Left panel shows representative flow plots of percentages of tetramer+ CD8 T cells. Right panel shows quantification of tetramer+ CD8 T cells as a percentage of all CD8 T cells. Data represent pooled biologically independent samples from three independent experiments (n = 5 for WT 1956-EV, n = 12 for WT, n = 6 for Ptgs2cKO (red) mice). Data are represented as mean values ± s.d. *P = 0.0232. c, Tumor growth curves of WT and Ptgs2cKO mice during the primary and secondary implantation of 1956 progressor tumors. Data represent mean ± s.e.m. of pooled biologically independent samples from two independent experiments (left) (n = 5 for WT, n = 5 for Ptgs2cKO (red) mice) or individual tumor growth curves (right). d, Proliferation of CTV-labeled OT-I CD8 T cells cultured for 72 h in vitro with migratory or resident cDCs from TDLNs of WT (black), Cd40cKO (Xcr1Cre/+ Cd40fl/fl, green), Cd70cKO (Xcr1Cre/+ Cd70fl/fl, orange) or Ptgs2cKO (red) mice that were injected with 106 1956-mOVA 14 days previously. Data represent pooled samples from two biologically independent experiments (n = 4–5 for migratory and n = 2–5 for resident cDCs). Data are represented as mean values ± s.d. b, Unpaired, two-tailed Mann–Whitney test. d, Brown–Forsythe and Welch ANOVA with Dunnett’s T3 multiple comparisons test.
A previous study noted that resident cDCs could present tumor-derived antigens at late times using the B16F10 melanoma model system36. We therefore asked whether resident cDCs could acquire the capacity for tumor antigen presentation at later times (Fig. 4d and Extended Data Fig. 2d,e). We compared migratory and resident cDCs from TDLNs of WT, Cd40cKO, Cd70cKO and Ptgs2cKO mice that were injected with 1956-mOVA tumors 14 days previously. In contrast to the progressively growing B16F10 tumor, the 1956-mOVA fibrosarcoma is a regressor tumor in WT mice17. In WT, Cd70cKO and Ptgs2cKO mice, which had all cleared tumors by day 14, migratory cDCs from TDLNs also showed no in vitro stimulation of OT-I proliferation, consistent with the lack of residual tumor. In Cd40cKO mice, which still harbored tumors on day 14, migratory cDCs were highly active in stimulating OT-I proliferation, whereas resident cDCs were still inactive (Fig. 4d and Extended Data Fig. 2e).
Loss of CD40 signaling reduces cDC1 survival during tumor response
CD70, 4-1BBL and COX-2 do not appear to explain the full effect of CD40-depedent licensing of cDC1. Because CD40 signaling influences the survival of B cells in the GC reaction, we wondered whether CD40 might also regulate cDC1 survival during responses to tumors. Tumor growth is roughly similar in WT and Cd40cKO mice for approximately the first week after inoculation (Fig. 5a), but tumors are fully eliminated after 14-16 days in WT mice and continue to grow in Cd40cKO mice. Therefore, we compared immune cell populations in TDLNs at day 6 between WT and Cd40cKO mice (Fig. 5b) to search for potential causes of the reduced tumor rejection. We found a substantial and statistically significant reduction in the migratory cDC1 population in Cd40cKO mice in TDLNs (Fig. 5c,d and Extended Data Fig. 6a). This reduction was specific to the migratory cDC1 population in the setting of tumor-bearing mice, because the resident cDC1 population was unchanged in tumor-bearing Cd40cKO mice compared to WT mice, and no change was observed at homeostasis in SDLNs or spleen in non-tumor-bearing mice (Extended Data Fig. 6b,c). Further, this reduction was specific to loss of CD40 signaling, because no reduction in migratory cDC1 was found in TDLNs in Cd70cKO mice (Fig. 5c,d and Extended Data Fig. 6b,d). These results suggest that loss of CD40 signaling may reduce cDC1 survival at some point during migration from the tumor microenvironment (TME) to antigen presentation in TDLNs.
Fig. 5 |. CD40 signaling in cDC1s mediates cDC1 survival during tumor challenge.
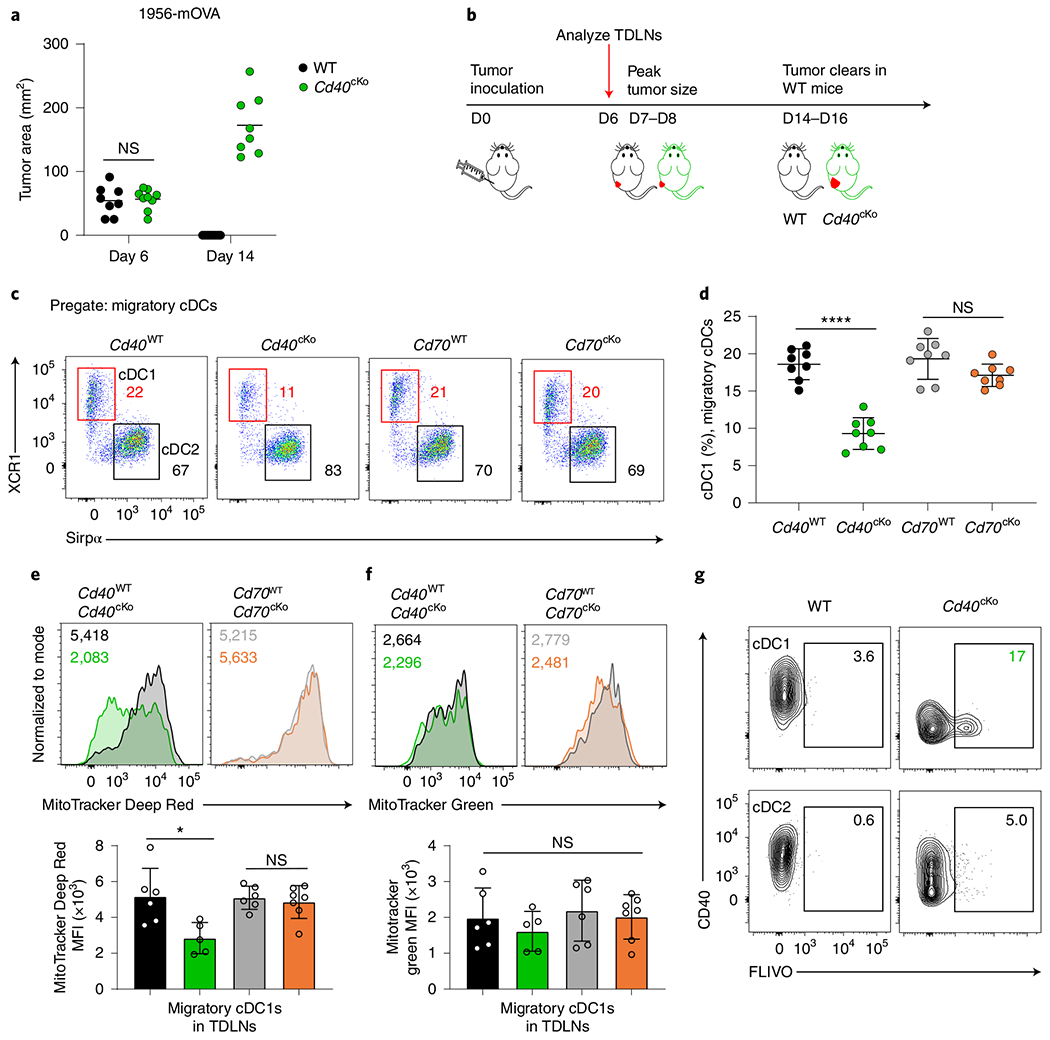
a, Day 6 and day 14 tumor areas of WT (Xcr1+/+ Cd40fl/fl) and Cd40cKO (Xcr1Cre/+ Cd40fl/fl) mice injected with 106 1956-mOVA cells. Data represent pooled biologically independent samples from three experiments (n = 8 for WT and n = 8 for Cd40cKO). b, Experimental setup for panels c–f. c, Representative flow plots showing migratory cDC1s (red) and cDC2s (black) from TDLNs of tumor-bearing Cd40WT (Xcr1+/+ Cd40fl/fl), Cd40cKO, Cd70WT (Xcr1+/+ Cd70fl/fl) and Cd70cKO (Xcr1Cre/+ Cd70fl/fl) mice (left to right). Cells are pregated as B220− CD326−MHC-II+ CD11cint. Numbers are percentages of cells in indicated gates. d, Quantification of panel c. Data represent pooled biologically independent samples from five experiments (n = 8 for all groups). Data represented as mean ± s.d. ****P < 0.0001. e, Top panel representative histograms of migratory cDC1s from TDLNs of Cd40WT (black), Cd40cKO (green), Cd70WT (gray) and Cd70cKO (orange) tumor-bearing mice stained with MitoTracker Deep Red FM. Numbers are the geometric MFI of MitoTracker Deep Red for samples in the similar color. Bottom panel shows a graph of the data above. Data represent pooled biologically independent samples from four experiments (n = 6 for Cd40WT, n = 5 for Cd40cKO, n = 6 for Cd70WT and n = 7 Cd70cKO). Data represented as mean ± s.d. *P = 0.0399. f, Top panel shows representative histograms of migratory cDC1s from TDLNs of Cd40WT (black), Cd40cKO (green), Cd70WT (gray) and Cd70cKO (orange) tumor-bearing mice stained with MitoTracker Green. Numbers are the geometric MFI of MitoTracker Green for samples in the similar color. Bottom panel shows a graph of the data above. Data represent pooled biologically independent samples from four experiments (n = 6 for Cd40WT, n = 5 for Cd40cKO, n = 6 for Cd70WT and n = 7 for Cd70cKO). Data represented as mean ± s.d. g, Representative flow plots showing activated caspase staining (FLIVO) and CD40 expression in migratory cDC1s (top) and cDC2s (bottom) of WT (Xcr1+/+ Cd40fl/fl) (left) and Cd40cKO (right) mice. Numbers are the percentages of cells in the indicated gates. Data represent pooled biologically independent samples from four experiments (n = 8 for WT and n = 8 for Cd40cKO). a,d,e,f, Brown–Forsythe and Welch ANOVA with Dunnett’s T3 multiple comparisons test.
Bcl2l1 was highly induced by CD40 signaling in cDC1s and potentially could contribute to enhanced cDC1 survival. Because Bcl-xL, like Bcl-2, regulates mitochondrial function, we first evaluated several mitochondrial parameters in WT and Cd40cKO tumor-bearing mice (Fig. 5e,f). For this, we used MitoTracker Deep Red FM and MitoTracker Green FM to assess mitochondrial transmembrane potential and mass, respectively37. We found a reduction in mitochondrial transmembrane potential in migratory cDC1s in Cd40cKO mice compared to WT mice but no changes in mitochondrial mass. By contrast, we found no changes in either mitochondrial transmembrane potential or mass in migratory cCD2s or migratory cDC1s in Cd70cKO tumor-bearing mice (Fig. 5e,f and Extended Data Fig. 6e). Like Bcl-2, Bcl-xL supports mitochondrial membrane integrity, preventing release of cytochrome c into the cytoplasm that then activates caspases and causes cell death. Thus, we compared in vivo caspase activation in cDC1 and cDC2 from WT and Cd40cKO tumor-bearing mice using the fluorescent active poly-caspase probe FAM-FLIVO38 on day 6 after tumor inoculation (Fig. 5g and Extended Data Fig. 6f). Migratory cDC1s from Cd40cKO mice showed elevated caspase activation compared to WT mice. This elevation in caspase activity was specific to migratory cDC1s and was not observed in resident cDC1 or cDC2 populations (Fig. 5g and Extended Data Fig. 6f). In summary, loss of CD40 on cDC1s in tumor-bearing mice leads to decreased mitochondrial transmembrane potential, increased caspase activation and apoptosis and decreased numbers of migratory DC1 in tumor-bearing lymph nodes.
CD40 signaling enhances cDC1 survival during antigen presentation
The results suggest that CD40 signaling enhances in vivo cDC1 survival during antigen presentation in lymph nodes during a tumor challenge. We wished to establish an in vitro system that replicates this survival effect during antigen processing and presentation by cDC1 to antigen-specific CD8 T cells (Fig. 6). First, we tested the effect of agonistic anti-CD40 antibody on survival in a competitive mixed culture of WT and Cd40cKO cDC1s (Fig. 6a). Poly(I:C) treatment without anti-CD40 antibody led to the equal survival of WT cDC1s and Cd40cKO cDC1s in this mixed co-culture system. However, addition of anti-CD40 antibody with poly(I:C) led to a selective survival of WT cDC1s over Cd40cKO cDC1s, suggesting that CD40 signaling provides a survival benefit. Next, we evaluated in vitro caspase activation and apoptosis directly in cDC1s during antigen processing and presentation to OT-I T cells (Fig. 6b,c). Antigen was provided as OVA osmotically loaded into MHC-I-deficient splenocytes with induction of CD40 surface expression on cDC1s using poly(I:C) and cDC1 licensing using anti-CD40 antibody. After 24 h, cells were incubated with the in vitro fluorescent caspase inhibitor probe FAM-FLICA for 1 h, and caspase activation and cell death in cDC1 assessed by FACS (Fig. 6b,c). Overall, caspase activity was substantially increased in Cd40cKO cDC1 compared with WT cDC1s. Further, late-stage apoptosis39, as assessed by FLICA and propidium iodide positivity, was also increased in Cd40cKO cDC1s compared to WT cDC1s. In this assay, mitochondrial transmembrane potential, but not mass, was mildly reduced in Cd40cKO cDC1s at the lower, but not higher, cDC1/OT-I T cell ratio (Fig. 6d,e). In agreement with these changes in mitochondrial transmembrane potential, we additionally found that cDC1s from Cd40cKO mice exhibit substantially reduced basal and maximal oxygen consumption rates (OCRs) as well as reduced extracellular acidification rates (ECARs) compared with WT cDC1s (Fig. 6g,h and Extended Data Fig. 6g,h). By contrast, cDC1s from Ptgs2cKO mice were only mildly affected in both OCR and ECAR. These observations agree with gene set expression enrichment analysis showing enhanced complex I biogenesis induced by CD40 signaling in cDC1s (Extended Data Fig. 6i). In summary, this in vitro system replicates the survival defect of cDC1s observed in Cd40cKO mice during tumor challenge in vivo.
Fig. 6 |. CD40 signaling mediates cDC1 survival during antigen presentation.
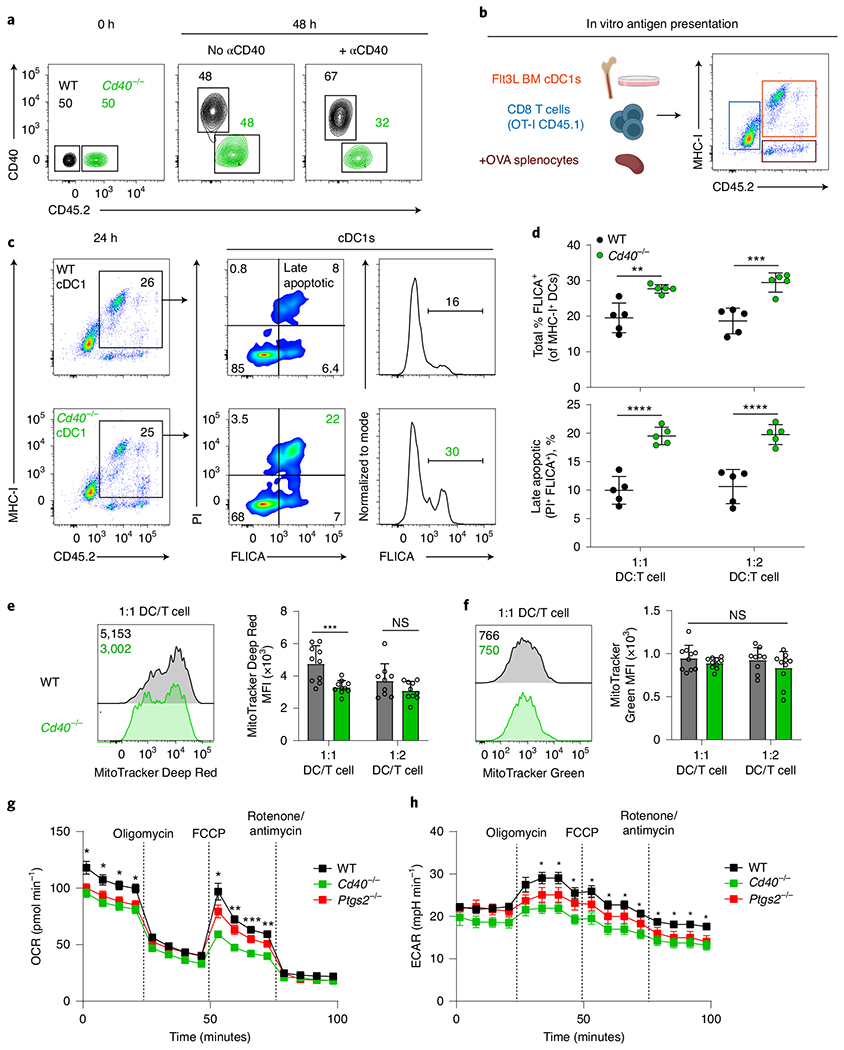
a, cDC1s were sorted from WT (Cd40+/+ CD45.2−, black) or Cd40−/− (CD45.2+, green) Flt3L-treated BM and cultured with CD8 T cells in the presence or absence of agonistic αCD40. Competitive survival was analyzed 48 h later. Numbers are percentages of cells in the indicated gates. b, Schematic diagram for experimental design used in panels c–f. Representative flow plot showing how cells can be distinguished by MHC-I and CD45.2 expression (cDC1s, MHC-I+ CD45.2+). Created with Biorender.com. c, Representative flow plots showing WT (top) and Cd40−/− (bottom) cDC1s. After 24 h culture as described in b, cells were incubated with FLICA and propidium iodide (PI), and cDC1 were analyzed by flow cytometry one hour later for PI and FLICA staining. Numbers are the percentages of cells in the indicated gates. Data represent two biologically independent experiments. d, Quantification of data shown in c at different cDC1:OT-I ratios (WT cDC1, black; Cd40−/− cDC1, green). Top, quantification of active caspase activity as a percent of MHC-I+ cDC1s. **P = 0.0016, ***P = 0.0001. Bottom, quantification of late apoptotic cells (FLICA+ Propidium iodide+) as a percent of MHC-I+ cDC1s. ****P < 0.0001. Data represent pooled independent samples from two biologically independent experiments (n = 5 for all groups). Data are represented as mean values ± s.d. e,f, Left graph shows representative two-color histograms of MitoTracker Deep Red FM (e) or MitoTracker Green FM (f) staining in WT (black) or Cd40−/− (green) cDC1s after 24 h culture described in panel b. Numbers are the geometric MFI of MitoTracker. Right graph shows data presented as individual samples. Data represent pooled independent samples from two biologically independent experiments (n = 9–10 for all groups). Data are represented as mean values ± s.d. ***P = 0.008. g,h, Extracellular flux analysis of cDC1s from WT (black), Cd40−/− (green) and Ptgs2cKO (red) Flt3L-treated BM. OCRs (g) or ECARs (h) before and after addition of pharmacological inhibitors are shown. Mean values of technical replicates ± s.e.m. of a representative experiment are shown. Plot representative of four biologically independent experiments. *P < 0.05; **P = 0.0020 and 0.0026; ***P = 0.0004. d–h, Two-way ANOVA with Šídák’s multiple comparisons test.
CD40-induced cDC1 survival is mediated by Bcl-xL
We used this in vitro system to evaluate the impact of Bcl2l expression on cDC1 survival during active antigen presentation. We first examined the effect of Bcl2l1 in a competitive mixed culture of Cd40−/− cDC1s (Fig. 7a). Cd40−/− cDC1s expressing either an empty vector retrovirus (EV) or a Bcl2l1-expressing retrovirus (Bcl-xL-RV) were generated by infecting BM progenitors cultured with Flt3L, as previously described40 (Extended Data Fig. 7a,b). Then, the relative survival of cDC1s either expressing or not expressing the retrovirus were compared in a 50:50 mixture during antigen presentation (Fig. 7a,b). We found no survival benefit of EV-expressing Cd40−/− cDC1s compared with uninfected Cd40−/− cDC1s at either 24 or 48 h after stimulation. However, Bcl-xL-RV expression in Cd40−/− cDC1s caused a dramatic enhancement of cell survival, at both 24 and 48 h after antigen stimulation. Finally, we asked whether Bcl2l1 expression could reverse the increase in caspase activation and apoptosis seen in Cd40−/− cDC1s (Fig. 7c,d). For this, we generated Cd40−/− cDC1s expressing either EV or Bcl-xL-RV in Flt3L-treated BM cultures as above. Then, we evaluated caspase activation and apoptosis in these cDC1 populations during antigen presentation to OT-I T cells (Fig. 7c,d). We found that expression of EV had no impact on caspase activation or apoptosis compared to uninfected Cd40−/− cDC1s (Fig. 7c,d). However, we found that Bcl-xL-RV expression in Cd40−/− cDC1s led to a significant reduction in total caspase activation, as well as early and late apoptosis (Fig. 7c,d). These results show that the induction of Bcl-xL expression in CD40-stimulated cDCs provides a survival advantage to cDC1s during antigen presentation.
Fig. 7 |. CD40 help induces Bcl-xL for cDC1 survival for antigen presentation.
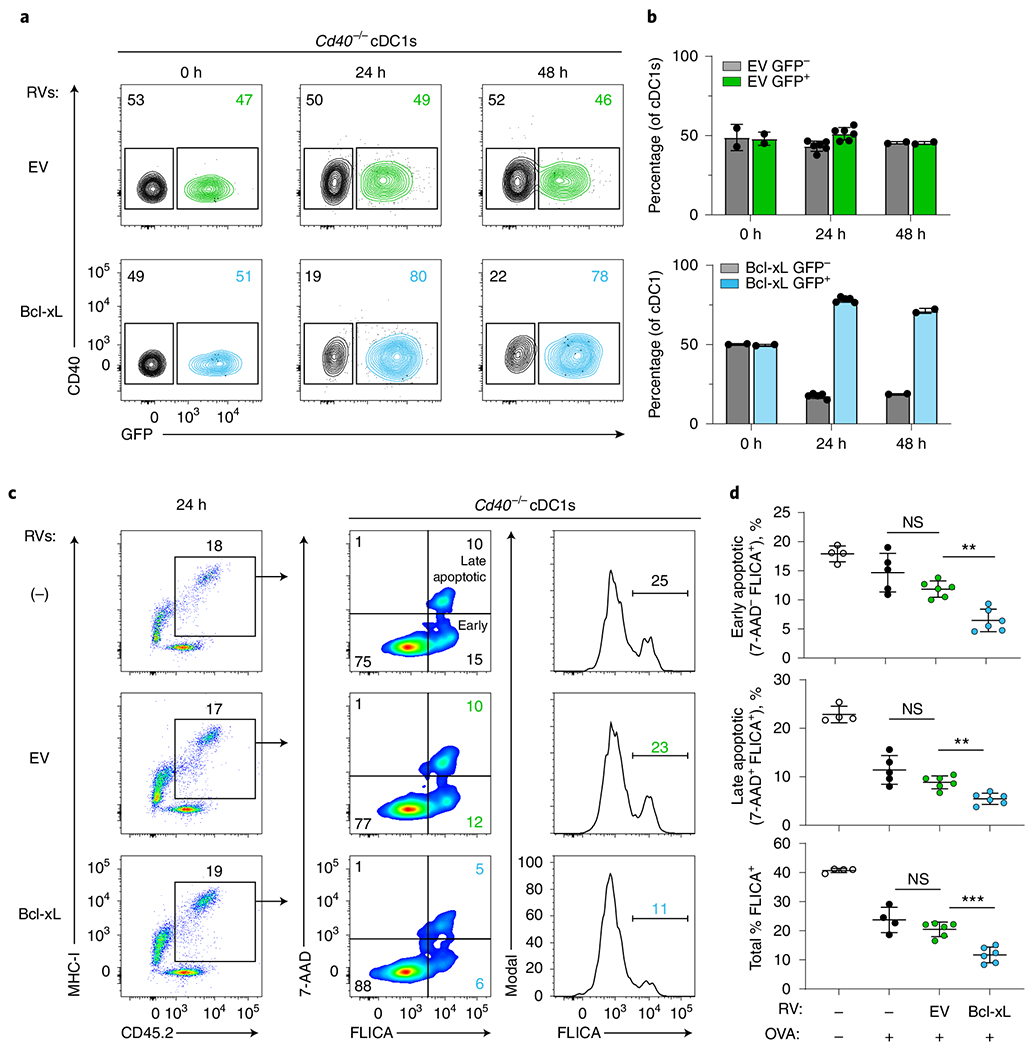
a,b, Flt3L-treated BM from Cd40−/− mice was transduced to express EV (empty vector, green) or Bcl-xL (blue) retrovirus (RV). On day 10, transduced (GFP+) and untransduced (GFP−) cDC1s were sorted and co-cultured at a 50:50 ratio for 24 or 48 h. a, Representative flow plots comparing survival of Cd40−/− cDC1s untransduced (GFP−) and transduced (GFP+) with EV (top) or Bcl-xL (bottom) at 0 h, 24 h and 48 h. Numbers are the percentages of cells in the indicated gates. b, Quantification of data in panel a. Percentage of EV-expressing (green, top) or Bcl-xL-expressing (blue, bottom) cDC1s versus uninfected cDC1s (gray bars). Data represent pooled independent samples from two biologically independent experiments (n = 2 for 0 h and 48 h, n = 6 for EV at 24 h and n = 5 for Bcl-xL at 24 h). Data are represented as mean values ± s.d. c,d, Flt3L-treated BM from Cd40−/− mice was retrovirally transduced to express EV (green) or Bcl-xL (blue). On day 10, transduced (GFP+) cDC1s were sorted and cultured with OVA-loaded splenocytes and OT-I CD8 T cells for antigen processing and presentation. After 24 h, cells were incubated with FLICA and 7-AAD for 1 h before analysis by flow cytometry. c, Representative flow plots showing untransduced Cd40−/− cDC1s (top) and Cd40−/− cDC1s retrovirally expressing EV (middle) or Bcl-xL (bottom). d, Quantification of data shown in panel c comparing caspase activity and apoptosis among untransduced Cd40−/− cDC1s in the absence (clear) and presence (black) of antigen and Cd40−/− cDC1s expressing EV (green) or Bcl-xL (blue). Top, early apoptotic cells (FLICA+ 7-AAD−) as a percentage of MHC-I+ cDC1s. **P = 0.0011. Middle, late apoptotic cells (FLICA+ 7-AAD+) as a percentage of MHC-I+ cDC1s. **P = 0.0023. Bottom, quantification of cells with activated caspases as a percentage of MHC-I+ cDC1s, ***P = 0.0005. Data represent pooled independent samples from two biologically independent experiments (n = 4 for RV-OVA−, n = 4-5 for RV− OVA+, n = 6 for EV OVA+, and n = 6 for Bcl-xL OVA+ groups). Data are represented as mean values ± s.d. d, Brown–Forsythe and Welch ANOVA with Dunnett’s T3 multiple comparisons test.
Finally, we tested the in vivo role of Bcl-xL by crossing Bclxfl/fl mice41 with the Xcr1Cre deleter strain to generate Bcl-xLcKO mice (Fig. 8). First, we confirmed that the induction of Bcl-xL by CD40 signaling was selectively ablated in cDC1s, but not cDC2s, in Bcl-xLcKO mice (Fig. 8a and Extended Data Fig. 8a), as expected. However, this loss of Bcl-xL in cDC1s did not affect CD40 or MHC-II expression by cDC1s (Extended Data Fig. 8b). As seen for CD70 and COX-2, loss of Bcl-xL in cDC1s did not eliminate the ability to reject tumors (Fig. 8b), but it did lead to a substantial reduction in the numbers of migratory cDC1 in TDLNs (Fig. 8c,d and Extended Data Fig. 8c,d). This reduction was similar to the reduced numbers of migratory cDC1 in Cd40cKO mice. By contrast, numbers of migratory cDC1 were not affected in Ptgs2cKO mice (Extended Data Fig. 8c,d). The loss of Bcl-xL in cDC1 was associated with dramatically reduced expansion of tumor-specific CD8 T cells (Fig. 8e,f). By contrast, the numbers of resident cDC1 were not affected in Bcl-xLcKO mice, similar to Cd40cKO and Ptgs2cKO mice (Extended Data Fig. 8e–g). In summary, these results indicate that CD40-induced Bcl-xL expression supports the survival of cDC1 during antigen presentation that enhances the extent of specific CD8 T cell expansion. Again, similar to CD70 and COX-2, Bcl-xL contributes only a partial component of CD40 help in anti-tumor responses.
Fig. 8 |. Loss of Bcl-xL in cDC1s reduces cDC1 and CD8+ T cell expansion during tumor challenge.
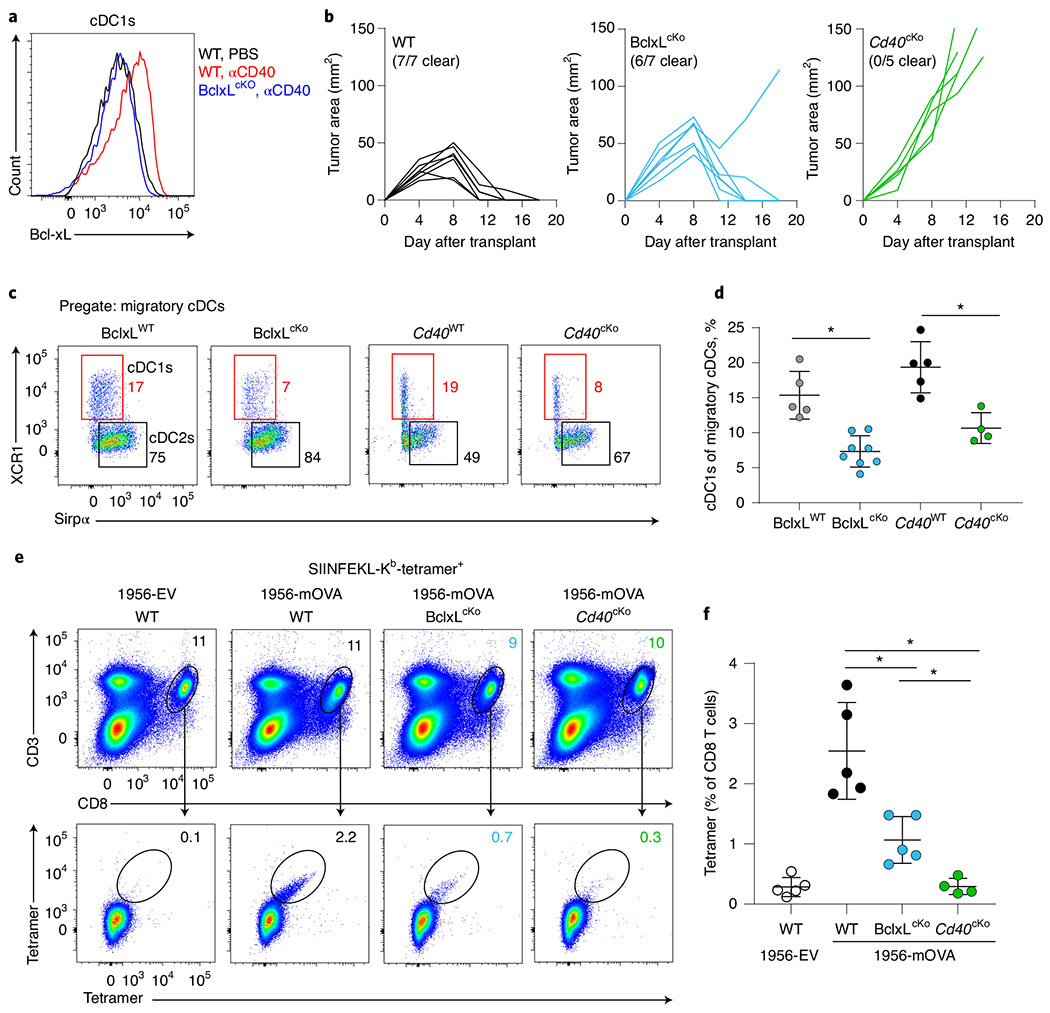
a, Representative histogram of Bcl-xL staining in cDC1 from mesenteric lymph nodes of WT and BclxLcKO mice injected intraperitoneally (i.p.) with phosphate-buffered saline (PBS) (black) or agonistic CD40 antibody (red, blue). b, Tumor growth curves of WT (Xcr1+/+ Bclxfl/fl), BclxLcKO (Xcr1Cre/+ Bclxfl/fl) and Cd40cKO (Xcr1Cre/+ Cd40fl/fl) mice (left to right) injected subcutaneously with 106 1956-mOVA cells. c, Representative flow plots showing migratory cDC1s (red boxes) and cDC2s (black boxes) from TDLNs of tumor-bearing BclxLWT, BclxLcKO, Cd40WT (Xcr1+/+ Cd40fl/fl) and Cd40cKO mice (left to right). Cells are pregated as B220− CD326−MHC-II+ CD11cint. Numbers are percentages of cells in the indicated gates. d, Quantification of data in panel c. Data represent pooled biologically independent samples from two independent experiments. (n = 5 for BclxLWT, n = 8 for BclxLcKO n = 5 for Cd40WT and n = 4 for Cd40cKO). Data are represented as mean values ± s.d. *P < 0.05. e,f, WT (Xcr1+/+Bclxfl/fl), BclxLcKO and Cd40cKO mice were injected with 106 1956-EV or 1956-mOVA cells, and spleens were stained for the presence of SIINFEKL-Kb tetramer+ CD8 T cells on day 10. e, Representative flow plots of percentages of tetramer+ CD8 T cells. f, Quantification of data in panel e depicting tetramer+ CD8 + T cells as a percentage of all CD8 T cells. Data represent pooled biologically independent samples from two independent experiments (n = 5 for WT 1956-EV, n = 5 for WT, n = 5 for BclxLcKO and n = 4 for Cd40cKO mice). Data are represented as mean values ± s.d. *P < 0.05. d,f, Brown–Forsythe and Welch ANOVA with Dunnett’s T3 multiple comparisons test.
Discussion
Our results show that CD40-dependent cDC1 licensing involves more than simply induction of costimulatory molecules such as CD70, but also includes other genes that regulate CD8 T cells expansion and the survival of cDC1 during antigen presentation. Importantly, of the CD40 targets identified here that contribute to CD8 T cell expansion, none appear “critical” to the overall rejection of tumors in the systems used in this study. This result argues for a more cooperative model in mediating CD40 help for cDC1 licensing that previously appreciated. In addition, these results emphasize that the magnitude of the CD8 T cell expansion that occurs in WT mice is greater than that needed for tumor rejection. Reduced expansion caused by inactivating the individual CD40 targets still allowed for tumor rejection in the majority of cases. Only with the CD70cKO was tumor rejection partially impaired, and then only with one of the tumor systems tested.
Using our recently reported Xcr1Cre deleter strain17 combined with the new conditional CD70 allele described here, we were able to evaluate the consequences of selective CD70 deficiency on cDC1s in anti-tumor responses in vivo. Although our results confirm that CD70 induction by CD40 signaling in cDC1s contributes to anti-tumor CD8 T cell expansion in vivo, we find CD70 induction does not mediate the full effect CD40 signaling in cDC1 for anti-tumor immunity. Tumor-specific CD8 T cell expansion was reduced in both CD70cKO and CD40cKO mice, although to different extents, compared to WT mice. However, CD70cKO mice showed only a partial failure in tumor rejection, compared to a complete failure in CD40cKO mice, suggesting that other CD4− target genes also contribute to the overall rejection of tumors. Here, we show that at least two other CD40 targets, Ptgs2 and Bcl2l1, also directly contribute to the overall anti-tumor response. Similar to CD70, Ptgs2 expression by cDC1 supports CD8 T cell expansion but does not strongly impact tumor rejection. Bcl2l1, similar to its actions in B cells, appears to support cDC1 survival during antigen presentation to CD8 T cells for the optimal generation of anti-tumor immunity.
We searched for targets of CD40 signaling in migratory cDC1s, because we previously found33 that these cells mediate the vast majority of antigen presentation to T cells in the 1956-mOVA fibrosarcoma system. Further, we subsequently found that CD4 help in this same system was mediated directly by CD4 T cell engagement of CD40 on cDC1s17. However, in other systems such as the B16F10 melanoma, resident cDCs may also be able to present tumor-derived antigens to T cells36. The difference between these tumor systems may be in the amount of antigen produced during the induction of the immune response. With 1956-mOVA, tumors are rejected by WT mice by days 10–14, when even migratory cDC1s no longer retain sufficient tumor antigen to activate T cell (Fig. 4d). However, with the B16F10 melanoma, tumors grow continuously in WT mice and may produce antigens in larger amounts sufficient for presentation by resident cDCs. Although we have used similar gating strategies to distinguish migratory and resident cDCs described by others42, conversion of resident cDCs in TDLNs into a functionally mature state could result in their inclusion in the ‘migratory gate’. Regardless of the migratory status of cDC1s, our results support a model in which CD40 is a hub at the center of a transcriptional response leading to induction of several important target genes that collectively contribute to the magnitude of the tumor-specific CD8 T cell response.
Until now, Ptgs2 has been considered to act against the generation of anti-tumor immunity34. COX-2, encoded by Ptgs2, can be expressed by both tumors as well as by cell of the innate and adaptive immune system43. COX-2 expression by tumor cells acts suppress anti-tumor immunity at the tumor site though the production of prostaglandin E2 (PGE2) that promotes an immunosuppressive microenvironment34. However, COX-2 expression by cDC1s in TDLNs has the opposite effect from that at the tumor site, supporting CD8 T cell expansion by cDC1. Although its effect is not as large as CD70’s, production of PGE2 by COX-2 expression in cDC1s could support CD8 T cell expansion through several known mechanisms44, including the further expression of costimulatory molecules45. However, because PGE2 has also been reported to suppress CD8 T cell proliferation46, the impact of Ptgs2 expression in cDC1s will required additional analysis. Conceivably, our results may differ from previous results34 because we have examined the impact of Ptgs2 on the priming stage for anti-tumor immunity, rather than in the TME, which involves many distinct processes. COX-1 can compensate for COX-2 in some instances47, but we did not find COX-1 to be transcriptionally altered by CD40 signaling. Nonetheless, our results do not exclude a potential contribution of COX-1 to cDC1 function.
Previous evidence linking CD40 signaling or Bcl-xL to DC survival came from in vitro studies48–51. DCs undergo apoptosis during in vitro and in vivo antigen presentation to T cells48,52. This idea was supported by the observation that transgenic overexpression of the baculovirus caspase inhibitor p35 increased numbers of cDCs in vivo53, although this was not recognized as being related to CD40-dependent DC licensing or shown to be a requirement for the in vivo response. However, in vitro analysis of human monocyte-derived DCs found that CD40 signaling reduced apoptosis caused by Fas ligand49. Also, compared to WT DCs, CD40-deficient DCs supported reduced in vitro expansion of DO11.10 T cells and showed reduced survival after transfer into recipient mice51. Thus, although CD40 has been shown to impact DC survival in vitro, no study has determined the underlying mechanism.
DC survival has been shown to be important in maintaining immune tolerance53. Transient expression of the anti-apoptotic Bcl-2 and Bcl-xL enhanced in vitro DC survival54, and mice with DC-specific deficiencies in the pro-apoptotic Bcl family members Bim, Bax and Bak developed autoimmune symptoms55. These findings suggest that tight control over DC lifespan by Bcl-2 family members is important during immune responses. CD40-induced Bcl2l1 expression reduced B cell apoptosis in vitro56 and in vivo57. Because Bcl2 and Bcl-xL can provide similar anti-apoptotic effects58, it was unclear which member might be relevant for CD40-induced survival in vivo. Transgenic overexpression of Bcl2 was found to enhance in vivo DC survival59, but we do not find Bcl2 to be highly induced by CD40 signaling in cDC1. Overexpression of Bcl-xL into GM-CSF-derived monocyte-derived dendritic cells reduced in vitro apoptosis60,61. Further, TNF treatment reduced in vitro Fas-mediated apoptosis and was correlated with increased Bcl-xL expression50. In summary, our results suggest that CD4-dependent help for CTL responses involves not only the induction of costimulatory ligands, such as CD70, on cDC1s, but also the enhancement of cDC1 survival by CD40-induced Bcl-xL expression.
Although some CD40-induced genes contributed to cDC1 survival, CD8 T cell expansion and tumor rejection, we did not find a major impact on anti-tumor memory. CD40 signaling was found to be required for T cell memory in the setting of viral infections62,63. Its site of action was shown to be an APC for LCMV infections64, and to be specifically the cDC1 for memory to tumors17. Some studies have implied that CD70 and CD27 play an important role in T cell memory with protein immunization65, viral infections30 and tumors66. In contrast, we find no requirement for CD70 or CD27 in memory responses capable of rejecting the 1956 fibrosarcoma. Thus, although we find complete agreement with the requirement for CD40 in in CD8 T cell memory, there appears to be different levels of dependence for effective memory on the CD70/CD27 axis between various biological settings. Conceivably, tumor rejection might require stronger CD8 T cell responses compared with viral infections, and may rely on the additional cDC1 survival during CD8 T priming provided by Bcl-xL induction by CD40. Enhancing DC function using CD40 agonists in cancer therapy has been cited as a goal in clinical trials. Our studies may help to understand the mechanism for CD40 actions to better leverage DCs in settings such as cancer therapy.
Methods
Mice
C57BL/6 J (B6), C57BL/6-Tg(TcraTcrb)1100 Mb/J (OT-I), B6.SJL-Ptprca Pepcb/BoyJ (CD45.1), B6.129S4-Gt(ROSA)26Sortm1(FLP1)Dym/RainJ (R26FLP), B6.129P2(FVB)-Cd27tm1Jbo/J (Cd27−/−), B6;129S4−Ptgs2tm1Hahe/J (Ptgs2fl/fl) were purchased from The Jackson Laboratory. CD45.1 mice were bred to OT-I to produce CD45.1 OT-I. MHC-I TKO mice (Kb−/−Db−/−β2m−/−) were originally provided by T. Hansen (Washington University, St. Louis, MO)67. Cd40tm1a(KOMP)Wtsi were obtained from the KOMP Repository and converted to a conditional allele by breeding to R26FLP mice as described previously17. Resulting mice harbor two loxP sites flanking exons 2–4 of Cd40 (Cd40fl/fl). Cd40−/− were obtained by breeding mice with germline deletions of Cd40.BclXfl/fl were kindly provided by T. Gershon (University of North Carolina, Chapel Hill, NC). Xcr1Cre mice (stock no. 035435, The Jackson Laboratory) were generated in-house and described previously17.
Xcr1Cre mice with germline deletion of CD40, CD70, COX-2 or Bcl-xL were excluded from our study.
All mice were maintained on the C57BL/6 background in the Washington University St. Louis School of Medicine specific-pathogen-free animal facility following institutional guidelines and with protocols approved by the AAALAC-accredited Animal Studies Committee at Washington University in St. Louis. All animals were maintained on 12-h light cycles and housed at 21 °C and 50% humidity. Mouse chow was from LabDiet (53WU Irradiated PicoLab Rodent Diet 20). Experiments were performed with mice at 6–14 weeks of age, with sex-matched littermates whenever possible.
Generation of CD70 conditional KO mice
The Cd70fl/fl mice were generated as illustrated in Fig. 2a. gRNAs that flanked exon 1 of Cd70 were identified using GT-Scan (https://gt-scan.csiro.au/). Two 154-bp single-stranded oligodeoxynucleotide (ssODN) donors were used, each with 60-bp homology arms flanking a 34-bp loxP sequence. The following gRNA sequences were used: upstream 5′-caatcgtgtccaaatatttt-3'; downstream 5′-cttgagcggccgggaggatt-3'. The following ssODN sequences were used: Upstream 5′-tccaatgtgagctgtttataatggccccccatggaagagcctacaatcgtgtccaaatat ATAACTTCGTATAGCATACATTATACGAAGTTATtttgggaag cacaagggattcctggatgcggatgcttcctgatttcctagcattcagccc-3'; downstream 5′- cccaggagcagacgagggatcccggactgggaaagatgtcaccttgagcggccgggaggaATAACTTCGTATAGCATACATTATACGAAGTTATtttggttccccgactttccctaccatgcccgagattgacgcacacgttgttgggggctta-3'. Lowercase letters represent homology and uppercase letters are the inserted sequences. The Genetic Editing and iPS Cell (GEiC) center at Washington University in St. Louis ordered gRNAs with the desired sequences from IDT and conjugated with purified Cas9 protein to form the ribonucleoprotein complex. Donor ssODNs designed to introduce loxP sequences at the gRNA break site via homology-directed repair were added to the ribonucleoprotein complex. Day 0.5 single-cell B6 zygotes were isolated, and CRISPR reagents were introduced via electroporation by the Department of Pathology & Immunology Transgenic Mouse Core at Washington University in St. Louis and then transferred into the oviducts of day 0.5 pseudo-pregnant recipient mice. The resulting pups were screened by PCR followed by Sanger sequencing to identify those that had successfully incorporated both ssODNs on the same chromosome without disrupting the coding exon. One of 160 mice had the desired incorporations, and it was outcrossed to WT C57BL/6 J mice; resulting heterozygous mice were intercrossed to generate homozygous conditional allele mice.
Generation of Tnfrsf9−/− and Cd27−/− Tnfrsf9−/− mice
The Tnfrsf9−/− mice were generated as illustrated in Extended Data Fig. 5a. gRNAs that flanked exon 2, the first coding exon of Tnfrsf9 and that contains the translation initiation methionine, were identified using Benchling (https://www.benchling.com/crispr/). The following gRNA sequences were used: 5′, tgcatgtgacatttcgccatggg; downstream 5′, gttatcacaggagttctgcacgg. The Genetic Editing and iPS Cell (GEiC) center at Washington University in St. Louis ordered gRNAs from IDT, complexed gRNAs with Cas9 protein, and the reagents were electroporated into CD27 KO embryos that were generated by in vitro fertilization. The resulting pups were screened by PCR followed by Sanger sequencing to identify those that had successfully created a Tnfrsf9 null gene via indel. The resulting founders were outcrossed to Cd27−/− and WT C57BL/6 J mice to generate Cd27−/− Tnfrsf9−/− doubly deficient mice and Tnfrsf9−/− mice.
DC preparation
To harvest DCs from lymphoid tissues, spleens and SDLNs or TDLNs (axillary and inguinal) were digested in 5 ml complete IMDM (Iscove’s modified Dulbecco’s medium with 10% FCS, 2ME, penicillin/streptomycin, NEAA and glutamine) with 250 μg ml−1 collagenase B (Roche) and 30 U ml−1 DNaseI (Sigma-Aldrich) for 30–45 min at 37 °C with stirring. Erythrocytes (red blood cells) were lysed using ACK lysis buffer (150 mM ammonium chloride, 10 mM potassium bicarbonate and 0.1 mM EDTA). Single-cell suspensions were passed through 70-μm strainers and subsequently counted with a Vi-CELL analyzer (Beckman Coulter).
To prepare BM cultured DCs, tibias, femurs and hips from mice were crushed into MACS buffer, and red blood cells were removed with ACK lysis buffer. BM cells were cultured at 2 × 10⁶ cells ml−1 in 4 ml complete IMDM containing 5% Flt3L for 7–8 days. Loosely adherent cells were harvested for analysis.
In vitro and in vivo DC stimulation
For in vitro DC stimulation, 500,000 Flt3L-cultured cells were plated in complete IMDM and stimulated with αCD40 (10 μg ml−1, FGK4.5, BioXCell), poly(I:C) (4 μg ml−1, Sigma-Aldrich) or combined αCD40 + poly(I:C). Cells were stimulated for 24 h and then prepared for surface staining and flow cytometry. For in vivo DC stimulation, mice were injected i.p. with αCD40 (200 μg, BioXCell), poly(I:C) (150 μg, Sigma-Aldrich) or combined αCD40 + poly(I:C) in 150 αl PBS. After 24 h, spleens and SDLNs were harvested from mice and prepared for DC analysis as described above.
Tumor lines and growth experiments
The MCA-induced 1969 regressor and 1956 progressor fibrosarcomas were gifts from R. Schreiber (Washington University School of Medicine) and have been previously described68,69. The 1956-mOVA regressor fibrosarcoma expressing membrane OVA was generated from the 1956 fibrosarcoma as previously described17. For all tumors, cells were thawed from frozen stocks and propagated in R10 medium (RPMI + 10% FBS + 0.1% 2ME) for 5–7 days with one intervening passage in vitro. On the day of injection, cells were harvested by incubation in 0.05% trypsin-EDTA and washed three times with endotoxin-free PBS, and 2 × 10⁶ 1969 cells, 106 1956 cells or 106 1956-mOVA cells were injected subcutaneously in 150 μl PBS into the shaved flanks of mice. Tumor growth was measured with a caliper and presented as the surface area of the tumor (length × width). In accordance with our IACUC-approved protocol, maximal tumor diameter was 20 mm in one direction and mice were euthanized before maximal tumor burden was exceeded.
For anti-tumor memory experiments, 106 1956 cells were injected subcutaneously into mice (primary implantation). Tumors were resected after 8 days. Thirty days after resection, 106 1956 cells were injected subcutaneously into the contralateral flank (secondary implantation).
For CD8 T cell depletions, 200 μg depleting anti-mouse CD8β (Lyt 3.2) antibody (BioXCell) was injected i.p. once on either day −15 or day 8 of tumor challenge.
CD8+ T cell tetramer staining
Ten days after tumor injection, spleens were isolated, smashed between frosted microscope slides in complete IMDM (Iscove’s modified Dulbecco’s medium with 10% FCS, 2ME, penicillin/streptomycin, NEAA and glutamine) and subjected to ACK lysis. Gdp2 H-2Kb biotinylated monomers and SIINFEKL-H2-Kb biotinylated monomers were purchased from the immunomonitoring core lab at the Bursky center for human immunology and immunotherapy programs to assess endogenous CD8 T cells responses to the 1969 and 1956-mOVA fibrosarcomas, respectively. The peptide–MHC-I complexes refolded with an ultraviolet-cleavable conditional ligand were prepared as described with modifications70. Briefly, recombinant the H-2Kb heavy chain and the human β2 microglobulin light chain were produced in Escherichia coli, isolated as inclusion bodies and dissolved in 4 M urea, 20 mM Tris pH 8.0. MHC-I refolding reactions were performed by dialyzing a molar ratio of heavy chain/light chain/peptide of 1:1:8 against 10 mM potassium phosphate, pH 7.4 for 48 h. Refolded peptide–MHC-I complexes were captured by ion exchange (HiTrap Q HP, GE), biotinylated, and purified by gel filtration FPLC. Ultraviolet-induced ligand exchange and combinatorial encoding of MHC-I multimers was performed as described71. Then, the peptide–MHC multimers were incubated with BV605 and BV710 conjugated streptavidin (SA) at a concentration of 1:5 for 30 min at 4 °C protected from light in separate reactions. SA-labeled tetramers were then incubated with 25 μM D-biotin for 20 min at 4 °C protected from light to quench free fluorochrome-labeled SA.
Three million splenocytes were incubated with 10% BSA 2 mM EDTA PBS supplemented with 10% 2.4g2 supernatant for 15 min at 4 °C. Fluorochrome-conjugated tetramers were added to the splenocytes at a concentration of 3:50 and incubated at 37 °C for 15 min. Surface antibodies were added without washing and stained for another 30 min at 4 °C.
In vivo and in vitro antigen presentation assays
In vivo cross-presentation assays were performed to analyze proliferation of CD8 T cells as described previously16,72. Spleens from CD45.1 OT-I TCR transgenic mice were harvested, mashed and depleted of Ter119-, CD19-, I-A/I-E-, CD4- and Ly6G-expressing cells using MagniSort Streptavidin negative selection beads (Invitrogen) according to manufacturer’s protocol. Naive OT-I T cells were sorted as TCRβ+ CD8+ CD4− Vα2+ CD44− CD62L+ cells, labeled with 1 μM CTV (Thermo Fisher Scientific) proliferation dye, and 500,000 OT-Is were transferred intravenously (i.v.) into mice. The following day, MHC-I TKO splenocytes were osmotically loaded with 10 mg ml−1 soluble OVA (Worthington Biochemical Corporation) and irradiated at 1,350 rad, and 500,000 cells were injected i.v. into mice. After 3 days, spleens of recipient mice were harvested, mashed and analyzed for CTV dilution of OT-I cells.
To analyze DCs during antigen processing and presentation, in vitro antigen-presentation assays were performed using 25,000 sorted Flt3L-treated BM cDC1s, 25,000 or 50,000 CTV-labeled OT-I cells and 50,000 OVA-loaded splenocytes (prepared as described above) co-cultured for 24 h in complete IMDM. To induce cDC1 expression of CD40 and then stimulate CD40 signaling, poly(I:C) (2 μg ml−1) and agonistic aCD40 antibody (20 μg/ml, BioXCell) were added, respectively.
Alternatively, migratory and resident cDCs were sorted from TDLNs of mice 4 or 14 days after subcutaneous implantation of 1956-mOVA fibrosarcoma cells and cultured in 96-well round bottom plates with CTV-labeled naïve OT-I T cells (10,000 cDCs/25,000 OT-I). When noted, CD40 stimulation was provided by adding αCD40 (20 μg ml−1; BioXCell). CTV dilution was analyzed 72 h later.
In vitro T cell stimulation
Spleens were isolated from mice, mechanically disrupted into a single-cell suspension and depleted of CD19-, CD11c-, Ly6G-, Ter119- and MHC-II-expressing cells using MagniSort SAV negative selection beads (Invitrogen) according to manufacturer’s protocol. In a 96-well U-bottom plate, 100,000 cells per well were cultured in complete IMDM with plate-bound anti-CD3 (10 μg ml−1, clone 145-2C11) and soluble anti-CD28 (2 μg ml−1, clone 37.51) for 24 h. Cells were then analyzed by flow cytometry for CD27 and 4-1BB surface expression.
Competitive mixed DC culture assays
To compare survival capacity of cDC1s, competitive mixed cultures were performed by mixing sort-purified cDC1s from Flt3L-treated BM cultures in a 50:50 ratio and culturing 25,000 cDC1s and 25,000 naïve OT-Is for 24 and 48 h in the absence of antigen. When testing the effect of CD40 stimulation on survival, cells were treated with poly(I:C) (2 μg ml−1) to induce CD40 surface expression and then agonistic aCD40 antibody (20 μg ml−1, BioXCell).
Transfection and transduction
EV-GFP plasmid was as previously described73. Bcl-x GFP plasmid (pMIG Bcl-xL) was a gift from S. Korsmeyer (Addgene, plasmid 8790; http://n2t.net/addgene:8790; RRID:Addgene_8790)74. Plat-E cells were plated in six-well cell culture plates at a density of 0.4 × 10⁶ cells ml−1 and incubated overnight at 37 °C. Retroviral plasmid DNAs mixed with TransIT-LT1 (Mirus Bio) in Opti-MEM reduced serum medium were transfected into the Plat-E cells and incubated overnight. The culture media was changed, and the supernatant containing retroviruses was collected 24 h later. For retroviral transduction, lineage depleted BM progenitors (CD3− B220−Ly6G−Ter119−CD105− CD11b−Ly6c−) were used. Progenitors were purified with biotinylated antibodies MagniSort SAV negative selection bead and cultured in complete IMDM supplemented with 5% stem cell factor conditioned media75 overnight at 37°C. After removing the culture media, the cells were transduced with the supernatant containing retroviruses in the presence of 2 μg ml−1 polybrene by spinoculation at 729 × g for 1 h at room temperature, and again incubated overnight. The culture media was changed 24 h later. After an additional 24 h, the culture media was replaced with complete IMDM supplemented with 5% Flt3L conditioned media and cultured further for 7 days, and then transduced cells expressing the construct (GFP+) and untransduced cells (GFP−) DC1s were sorted for experimentation.
Metabolic and apoptotic assays
To measure mitochondrial membrane potential and mass, MitoTracker Deep Red FM and MitoTracker Green FM (Thermo Fisher) were loaded into single-cell suspensions for 20 min at 4 °C. To detect apoptotic cells in vivo during tumor challenge, the fluorogenic substrate FAM-FLIVO (ImmunoChemistry Technologies) was injected s.c. into tumor-bearing flanks of mice, and TDLNs were harvested for analysis 1 h later. To detect apoptotic cells in vitro during antigen processing and presentation, FAM-FLICA or SR-FLICA (ImmunoChemistry Technologies) was added to cells after 24 h culture and incubated for 1 h before analysis. Propidium iodide (0.05%, ImmunoChemistry Technologies) was also added to detect apoptosis. All extracellular flux assays were performed with Seahorse Bioscience XF96 Analyzers. Inhibitors were added at the following final concentrations: oligomycin (1 μM), FCCP (1.5 μM) and rotenone/antimycin A (0.5 μM).
Expression microarray analysis
C57BL/6 J (B6) SDLNs were harvested and digested in collagenase B (0.25 mg ml−1) and DNAse1 (30 U ml−1) in complete IMDM (Iscove’s modified Dulbecco’s medium with 10% FCS, 2ME, penicillin/streptomycin, NEAA and glutamine) for 40 min at 37 °C with stirring. Cells were depleted of CD3-, CD19-, Ter119- and Ly6G-expressing cells by staining with the corresponding biotinylated antibodies, followed by depletion with MagniSort Streptavidin Negative Selection Beads (Thermo Fisher Scientific). All remaining SDLN cells were then stained with fluorescent antibodies before sorting. cDC1s were sorted as B220− MHC-IIhi CD11cint XCR1+ CD172α− CD40+ into complete IMDM and cultured in the presence or absence of agonistic αCD40 antibody (10 μg ml−1) in 96-well U-bottom plates. After 24 h, live cells (DAPI−) were sorted directly into cell lysis buffer.
RNA from sorted DC populations was extracted with a NucleoSpin RNA XS Kit (Machery-Nagel), and was then amplified with WT Pico System (Affymetrix) and hybridized to GeneChip Mouse Gene 1.0 ST microarrays (Affymetrix) for 18h at 45 °C in a GeneChip Hybridization Oven 640. The data were analyzed using the Affymetrix GeneChip Command Console. Microarray expression data were processed using Command Console (Affymetrix) and the raw (.CEL) files generated were analyzed using Expression Console software with Affymetrix default Robust Multichip Analysis Gene analysis settings (Affymetrix). Probe summarization (Robust Multichip Analysis), quality control analysis and probe annotation were performed according to recommended guidelines (Expression Console Software, Affymetrix). Data were normalized by robust multiarray average summarization and underwent quartile normalization with ArrayStar software (DNASTAR). Expression microarray data were analyzed by GSEA as previously described76. Microarray data are available in the Gene Expression Omnibus database with the accession number GSE211426.
Antibodies and flow cytometry
The following antibodies were used from BioLegend: B220 (RA3-6B2; 103225), Siglec H (551; 129608), MHC-II (M5/114.15.2; 107636), XCR1 (ZET; 148204 and 148216), CD24 (M1/69; 138508), CD40 (3/23; 124612), CD326 (G8.8; 118227), CD8 (53-6.7; 100751), Streptavidin BV650 (405231), Streptavidin BV711(405241), CD27 (LG.3A10; 124209), CD137 (17B5; 106105), CD45.2 (104; 109814), MHC-I (AF6-88.5; 116523), 7-AAD (420403), CD137L (TKS-1; 107105), CD44 (IM7; 103028), CD62L (MEL-14; 104420), CD3 (145-2C11; 100306), CD19 (MB19-1; 101504), Ter119 (Ter119; 116204), CD11b (M1/70; 101204), CD4 (GK1.5; 100412). The following antibodies were used from BD Biosciences: CD127 (SB/199; 562959), Ly6C (AL-21; 557359), Ly6G (1A8; 567599). The following antibodies were used from eBioscience/Invitrogen: CD11c (N418; 47-0114-82), Sirpα (P84; 46-1721-82), F4/80 (BM8; 12-4801-82), CD70 (FR70; 12-0701-82), TCRβ (T cell receptor β chain) (H57-597; 25-5961-82), Va2 (B20.1; 12-5812-82), CD105 (MJ7/18; 13-1051-82). The following antibody was used from Tonbo: CD45.1 (A20; 35-0453-U100). The following antibody was used from Cell Signaling Technology: Bcl-xL (54H6; 2764 S). The following antibodies were used from BioXCell: CD8β (Lyt 3.2; BE0223), CD40 (FGK4.5; BE0016-2).
Statistics
Statistical analysis was performed using GraphPad Prism software version 9. All center values correspond to the mean, and all error bars indicate the s.d. unless otherwise noted. No statistical methods were used to predetermine sample sizes, but our samples sizes are similar to those reported in previous publications. Welch and Brown–Forsythe ANOVA was used when groups were not assumed to have equal variances. Otherwise, data distribution was assumed to be normal, but this was not formally tested. Data collection and analysis were performed blinded when possible in the conditions of the experiments. No animals or data points were excluded from analyses.
Extended Data
Extended Data Fig. 1 |. CD40 stimulation induces CD70 and 4-1BBL expression in cDCs.
a, Hierarchical clustering of 89 genes induced at least two-fold in SDLN cDC1s treated in vitro in the absence or presence of agonistic αCD40 antibody (results averaged from three independent experiments). b, Day 8 Flt3L-treated WT (B6) bone marrow cultures were treated with no stimulation, agonistic αCD40 antibody, poly(I:C), or both. cDC1 surface expression of CD40 (top), CD70 (middle) and 4-1BBL (bottom) was analyzed by flow cytometry after 24 h. Pre-gate: B220− Siglec H− MHC class II+ CD11c+ XCR1+ Sirpα−. Numbers represent the percentage of cells in the indicated gates. Data represent two independent experiments. c, d, f, WT mice were injected i.p. with PBS, agonistic αCD40 antibody, poly(I:C), or both. c, Spleens were harvested 24 h after injection and cDC1 were analyzed for surface expression of CD40 and CD70 by flow cytometry. Pre-gate: B220− F4/80− MHC class II+ CD11c+ XCR1+ Sirpα−. Numbers represent the percentage of cells in the indicated gates. Data represent two independent experiments. d, SDLN were harvested 24 h after injection and cDC1 were analyzed for surface expression of CD40 and CD70 by flow cytometry. Pre-gate: B220− CD326− MHC class II+ CD11cint XCR1+ Sirpα−. Numbers represent the percentage of cells in the indicated gates. Data represent two independent experiments. e, Day 8 Flt3L-treated bone marrow cultures were treated with no stimulation, agonistic αCD40 antibody, poly(I:C), or both. cDC2 surface expression of CD40 and CD70 were analyzed by flow cytometry after 24 h. Pre-gate: B220− Siglec H− MHC class II+ CD11c+ XCR1−Sirpα +. Numbers represent the percentage of cells in the indicated gates. Data represent two independent experiments. f, SDLN were harvested 24 h after injection and cDC2 were analyzed for surface expression of CD40 and CD70 by flow cytometry. Pre-gate: B220− CD326− MHC class IIhi CD11cint XCR1− Sirpα +. Numbers represent the percentage of cells in the indicated gates. Data represent two independent experiments.
Extended Data Fig. 2 |. Analysis of migratory and resident cDCs for tumor-antigen presentation.
a, Experimental setup for Fig. 1c, d and Extended Data Fig. 2c. Migratory and resident cDCs from TDLN of B6 WT day 4 tumor-bearing mice were isolated and cultured in vitro with naïive CTV-labeled OT-I CD8 T cells in the presence or absence of agonistic CD40 antibody. Proliferation of OT-Is was analyzed 72 hours later. b, Gating strategy for migratory and resident cDCs. c, Representative flow plots depicting CD44 surface expression and CTV dilution of OT-Is as described in a. d, Experimental setup for Fig. 4d and Extended Data Fig. 2e to assess whether resident cDCs access tumor antigens at late stages of tumor challenge and prime naïive CD8 T cells. Migratory and resident cDCs were isolated from TDLNs of WT (black), Cd40cKO (Xcr1Cre/+ Cd40fl/fl, green), Cd70cKO (Xcr1Cre/+ Cd70fl/fl, orange), or Ptgs2cKO (red) mice that were injected with 106 1956-mOVA 14 days previously, although only Cd40cKO mice still had tumor, and cultured in vitro with naïive CTV-labeled OT-I CD8 T cells. Proliferation of OT-Is was analyzed 72 hours later. e, Representative flow plots depicting CD44 surface expression and CTV dilution of OT-Is as described in d.
Extended Data Fig. 3 |. CD70 deficiency does not impair cDC1 development.
a, Percentages of splenic cDCs (left) and T and B cells (right) between WT (Xcr1+/+ Cd70fl/fl, black circles) and Cd70cKO (Xcr1Cre/+ Cd70fl/fl, orange circles) mice at homeostasis. b, Representative flow plots depicting CD70 expression in cDC1 (left) and cDC2 (right) from Flt3L-treated BM cultures of WT (top) and Cd70cKO (bottom) stimulated with αCD40 + poly(I:C). c, Representative flow plots showing CD70 and CD40 expression in migratory cDC1s of naive SDLN (left) and day 6 TDLNs (1969 fibrosarcoma, top; 1956-mOVA, bottom) of WT (Xcr1+/+ Cd40fl/fl) and Cd40cKO (Xcr1+/+ Cd40fl/fl) mice. d, Proliferation of CTV-labeled OT-I CD8 T cells adoptively transferred into WT (Xcr1+/+ Cd70fl/fl, black circles) or Cd70cKO (orange circles) mice was analyzed 72 h after immunization with OVA-loaded splenocytes. Data represent pooled biologically independent samples from two independent experiments (n = 4 for WT and Cd70cKO –OVA splenocytes, n = 5-6 for WT and Cd70cKO + OVA splenocytes). Data represented as mean +/− s.d. e, Cd40WT (Xcr1+/+ Cd40fl/fl), Cd40cKO, Cd70WT (Xcr1+/+ Cd70fl/fl), and Cd70cKO mice were injected with 106 1969 cells, and spleens were stained for the presence of mGpd2 tetramer+ CD8 T cells on day 10. Data represent pooled biologically independent samples from three independent experiments (n = 3 for naive, n = 5 for Cd40WT, n = 5 for Cd40cKO, n = 6 for Cd70WT, and n = 5 for Cd70cKO mice). f, Individual tumor curves of WT (Xcr1+/+ Cd70fl/fl), Cd40cKO, and Cd70cKO mice during primary and secondary implantation with 1956 progressor tumor. d: Brown–Forsythe and Welch ANOVA with Dunnett’s T3 multiple comparisons test.
Extended Data Fig. 4 |. Early and late CD8 T cell responses support anti-tumor immunity.
a, Schematic diagrams of the depletion of CD8 T cells at early (red) or late (blue) time point during tumor response. b, T cell populations in peripheral blood after early or late CD8 T cell depletion. c, Tumor growth curves of mice depleted of CD8 T cells early (red) or later (blue) in tumor response as described in a. Data represented pooled biologically independent samples from two independent experiments (n = 5 for no depletion, n = 3 for early depletion, and n = 5 for late depletion) Data represented as mean +/− s.d.
Extended Data Fig. 5 |. CD8 T cell responses in Cd27−/−, Tnfrsf9−/−, and Cd27−/− Tnfrsf9−/− mice.
a, Schematic diagram showing generation of Tnfrsf9−/− mice. CRISPR/Cas9 and sgRNAs were used to target the first coding exon, exon II, resulting in a Tnfrsf9 null gene via indel. b, WT, Cd27−/−, and Tnfrsf9−/− mice were injected with 106 1969 cells, and spleens were stained for the presence of mGpd2 tetramer+ CD8 T cells on day 10. Data represent pooled biologically independent samples from five independent experiments (n = 6 for naive, n = 9 for WT, n = 8 for Cd27−/−, n = 5 for Tnfrsf9−/− mice). Data are represented as mean values +/− s.d. **P = 0.0023; ns = not significant. c, CD127, CD44, and CD62L geometric mean MFI of SPLENIC SIINFEKL-Kb-tetramer+ CD8 T cells on d10 of 1956-mOVA in WT, Cd27−/−, Tnfrsf9−/−, and Cd27−/−Tnfrsf9−/− mice. Data represent pooled biologically independent samples from four independent experiments (n = 12 for WT, n = 10 for Cd27−/−, n = 6 for Tnfrsf9−/− mice, and n = 8 for Cd27−/−Tnfrsf9−/− mice). Data are represented as mean values +/− s.d. **P = 0.0094, ***P = 0.0004, ****P = < 0.0001, ns = not significant. d, Individual tumor curves of WT (Cd27−/−) and Cd27−/− mice during primary and secondary implantation with 1956 progressor tumor. b,c: Brown–Forsythe and Welch ANOVA with Dunnett’s T3 multiple comparisons test.
Extended Data Fig. 6 |. cDC1s during homeostasis and tumor challenge in Cd40cKO and Cd70cKO mice.
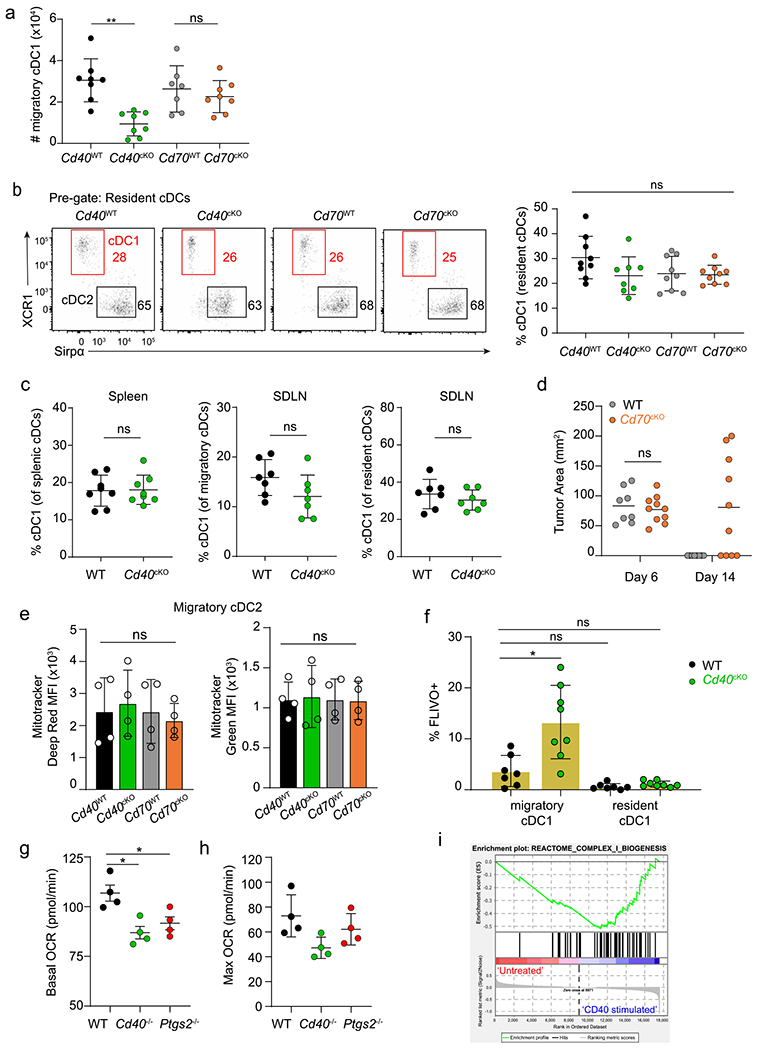
a, Quantification of migratory cDC1 number in TDLNs of tumor-bearing Cd40WT (Xcr1+/+ Cd40fl/fl, Cd40cKO (Xcr1Cre/+ Cd40fl/fl), Cd70WT (Xcr1+/+ Cd70fl/fl), and Cd70cKO (Xcr1Cre/+ Cd70fl/fl) mice as depicted in Fig. 5c. Data represent pooled biologically independent samples from five independent experiments (n = 7-8 for all groups). Data are represented as mean values +/− s.d. **P = 0.0022; ns, not significant. b, Left, Representative flow plots of resident cDC1s (red boxes) and cDC2s (black boxes) in TDLNs of day 6 1956-mOVA-bearing Cd40WT (Xcr1+/+ Cd40cKO), Cd40cKO (Xcr1Cre/+ Cd40fl/fl), Cd70WT (Xcr1+/+ Cd70fl/fl), and Cd70cKO (Xcr1Cre/+ Cd70fl/fl) mice. Cells are pregated as B220− CD326−MHC-II+ CD11chi. Numbers are percentages of cells in the indicated gates. Right, quantification of cDC1s as a percentage of resident cDCs. Data represent pooled biologically independent samples from five independent experiments (n = 8 for all groups). Data are represented as mean values +/− s.d. c, Quantification of cDC1s as a percentage of splenic (left), SDLN migratory (middle), and SDLN resident (right) cDCs in WT (Xcr1+/+ Cd40fl/fl) and Cd40cKO mice at homeostasis. Data represent pooled biologically independent samples from five independent experiments (n = 7 for all groups). Data are represented as mean values +/− s.d. ns, not significant. d, Day 6 and Day 14 tumor areas of WT (Xcr1+/+ Cd70fl/fl) and Cd70cKO mice injected with 106 1956-mOVA cells. Data represent pooled biologically independent samples from three independent experiments (n = 6-8 for WT and n = 10 Cd70cKO mice). ns, not significant. e, Mitotracker Deep Red FM (right) and Mitotracker Green FM (right) geometric mean MFI in TDLN migratory cDC2s of d6 1956-mOVA-bearing Cd40WT,Cd40cKO, Cd70WT, and Cd70cKO mice. Data represent pooled biologically independent samples from two independent experiments (n = 4 for all groups). Data are represented as mean values +/− s.d. ns, not significant. f, WT (Xcr1+/+ Cd40fl/fl) and Cd40cKO mice were injected with 106 1956-mOVA cells. On day 6, mice were injected with the fluorescent activated poly-caspase probe FAM-FLIVO, and then TDLNs were harvested after 1 h. Quantification of FLIVO + cells in migratory and resident cDC1s of WT and Cd40cKO mice. Data represent pooled biologically independent samples from four independent experiments (n = 7 for WT and n = 8 for Cd40cKO mice). Data are represented as mean values +/− s.d. *P = 0.0340, ns = not significant. g-h, Basal (g) and maximal (h) OCR from extracellular flux analysis of cDC1s from WT (black), Cd40−/− (green), and Ptgs2cKO (red) Flt3L-treated bone marrow cultures. Data represent mean values of four biologically independent experiments. Data are represented as mean values +/− s.d. *P < 0.05. i, Enrichment analysis of mitochondrial complex I biogenesis genes in cDC1 in the absence (red) or presence (blue) of CD40 stimulation. a-b, d-g: Brown–Forsythe and Welch ANOVA with Dunnett’s T3 multiple comparisons test. c: Mann–Whitney test.
Extended Data Fig. 7 |. Bcl-xL rescue of CD40 deficiency in cDC1.
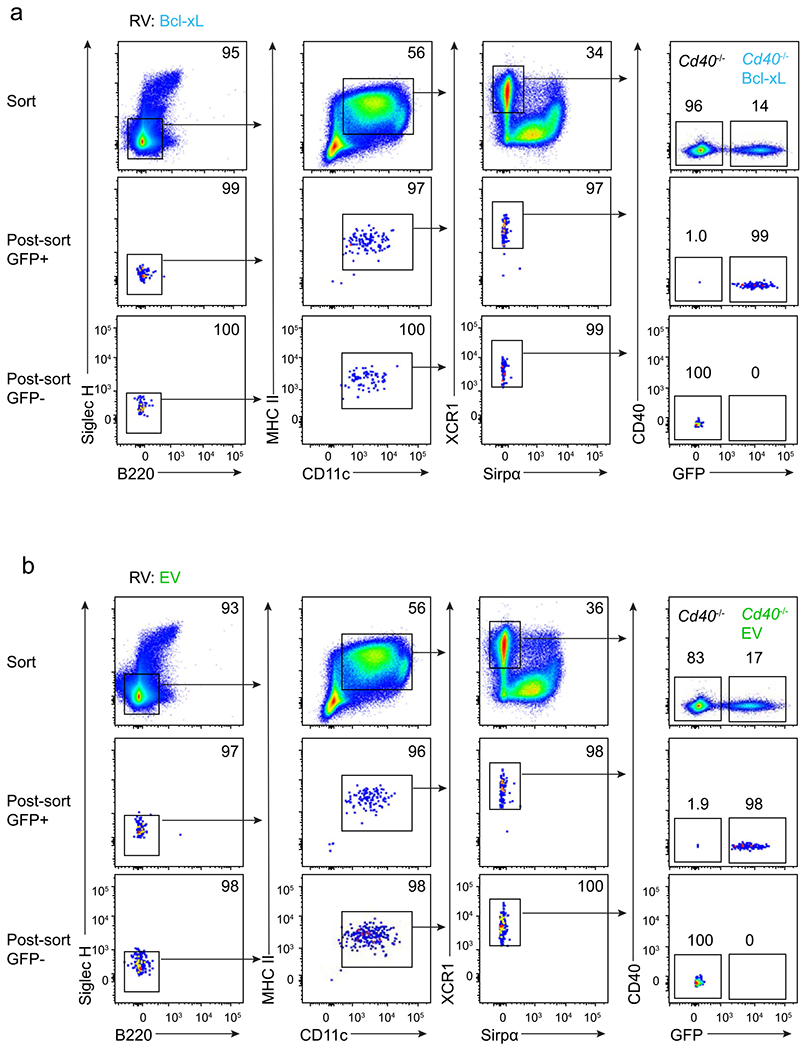
a, Flt3L-treated BM cultures from Cd40−/− mice were transduced with Bcl-xL, and cDC1s were sorted on day 10 of culture. Representative FACS plots depicting the full gating strategy (top) and the post-sort analysis for Bcl-xL-GFP+ expressing cDC1s (middle)and untransduced Bcl-xL-GFP− cDC1s (bottom) and. b, Flt3L-treated BM cultures from Cd40−/− mice were transduced with EV, and cDC1s were sorted on day 10 of culture. Representative FACS plots depicting the full gating strategy (top) and the post-sort analysis for EV-GFP+ expressing cDC1s (middle) and untransduced EV-GFP− cDC1s (bottom).
Extended Data Fig. 8 |. Conditional loss of Bcl-xL impairs survival of migratory, but not resident, cDC1.
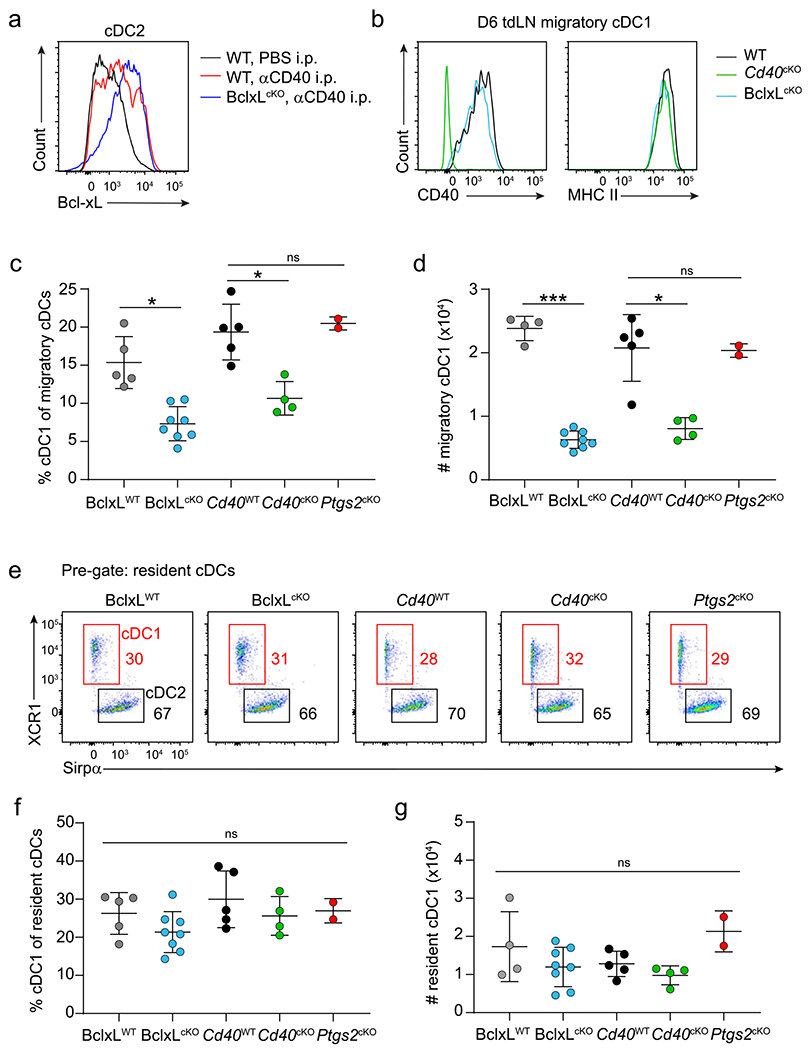
a, Representative histogram of Bcl-xL staining in cDC2 from mesenteric lymph nodes of WT and BclxLcKO mice injected i.p. with PBS (black) or agonistic CD40 antibody (red, blue). b, Representative histograms of CD40 and MHC-II surface expression in migratory cDC1 of TDLN from tumor-bearing WT (Xcr1+/+ Bclxfl/fl), Cd40cKO (Xcr1Cre/+ Cd40fl/fl), and BclxLcKO (Xcr1Cre/+ Bclxfl/fl) mice. c-d, Quantification of migratory cDC1 as a percentage (c) and number (d) from TDLNs of day 6 tumor-bearing BclxLWT, BclxLcKO, Cd40WT, Cd40cKO, and Ptgs2cKO (Xcr1Cre/+ Ptgs2fl/fl) mice. Data represent pooled biologically independent samples from two independent experiments (n = 4-5 for BclxLWT, n = 8 for BclxLcKO, n = 5 for Cd40WT, n = 4 for Cd40cKO, and n = 2 for Ptgs2cKO). Data are represented as mean values +/− s.d. *P = 0.0249, 0.0240; ***P = 0.0001; *P = 0.0257; ns, not significant. e, Representative flow plots of resident cDC1s (red boxes) and cDC2s (black boxes) in TDLNs of day 6 1956-mOVA-bearing BclxLWT, BclxLcKO, Cd40WT, Cd40cKO and Ptgs2cKO mice. Cells are pregated as B220− CD326−MHC-II+ CD11chi. Numbers are percentages of cells in the indicated gates. Data represent pooled biologically independent samples from two independent experiments. f-g, Quantification of resident cDC1s in e as a percentage (f) and number (g) from TDLNs of day 6 tumor-bearing BclxLWT, BclxLcKO, Cd40WT, Cd40cKO, and Ptgs2cKO mice. Data represent pooled biologically independent samples from two independent experiments (n = 4-5 for BclxLWT, n = 8 for BclxLcKO, n = 5 for Cd40WT, n = 4 for Cd40cKO, and n = 2 for Ptgs2cKO). Data are represented as mean values +/− s.d. ns, not significant. c,d,f,g: Brown–Forsythe and Welch ANOVA with Dunnett’s T3 multiple comparisons test.
Acknowledgements
This publication is solely the responsibility of the authors and does not necessarily represent the official view of the National Institutes of Health (NIH). This work was supported by the NIH (R01AI150297, R01CA248919, and R21AI164142 to K.M.M., R01CA190700 and T32CA009547 to R.D.S, and F30CA247262 to R.W.) S.T.F. is a Cancer Research Institute Irvington Fellow supported by the Cancer Research Institute. We thank J. M. White at the Department of Pathology & Immunology Transgenic Mouse Core at Washington University in St. Louis and the Genetic Editing and iPS Cell Center at Washington University in St. Louis for the generation of mouse models, the Genome Technology Access Center at the Department of Genetics at Washington University School of Medicine in St. Louis for help with genomic analysis, the Andrew M. and Jane M. Bursky Center for Human Immunology and Immunotherapy Programs and Alvin J. Siteman Comprehensive Cancer Center for help with tetramer production, and the Diabetes Research Core (NIH P30 DK020579) for help with extracellular flux assays.
Competing interests
R.D.S. is a co-founder, paid consultant and stockholder of Jounce Therapeutics and Asher Biotherapeutics and paid consultant and stockholder of A2 Biotherapeutics, Arch Oncology, Asher Biotherapeutics, Codiak Biosciences, NGM Biotherapeutics, Meryx and Sensei Biotherapeutics. K.M.M. is a paid member of the scientific advisory board of Harbour BioMed. The other authors declare no competing interests.
Footnotes
Online content
Any methods, additional references, Nature Research reporting summaries, source data, extended data, supplementary information, acknowledgements, peer review information; details of author contributions and competing interests; and statements of data and code availability are available at https://doi.org/10.1038/s41590-022-01324-w.
Reporting summary
Further information on research design is available in the Nature Research Reporting Summary linked to this article.
Extended data are available for this paper at https://doi.org/10.1038/s41590-022-01324-w.
Supplementary information The online version contains supplementary material available at https://doi.org/10.1038/s41590-022-01324-w.
Data availability
Microarray data generated in the current study are available in the Gene Expression Omnibus database with the accession number GSE211426. Source data are provided with this paper.
References
- 1.Cantor H & Boyse EA Functional subclasses of T lymphocytes bearing different Ly antigens. II. Cooperation between subclasses of Ly+ cells in the generation of killer activity. J. Exp. Med 141, 1390–1399 (1975). [DOI] [PMC free article] [PubMed] [Google Scholar]
- 2.Clark EA & Ledbetter JA Activation of human B cells mediated through two distinct cell surface differentiation antigens, Bp35 and Bp50. Proc. Natl Acad. Sci. USA 83, 4494–4498 (1986). [DOI] [PMC free article] [PubMed] [Google Scholar]
- 3.Armitage RJ et al. Molecular and biological characterization of a murine ligand for CD40. Nature 357, 80–82 (1992). [DOI] [PubMed] [Google Scholar]
- 4.Spriggs MK et al. Recombinant human CD40 ligand stimulates B cell proliferation and immunoglobulin E secretion. J. Exp. Med 176, 1543–1550 (1992). [DOI] [PMC free article] [PubMed] [Google Scholar]
- 5.Hollenbaugh D et al. The human T cell antigen gp39, a member of the TNF gene family, is a ligand for the CD40 receptor: expression of a soluble form of gp39 with B cell co-stimulatory activity. EMBO J. 11, 4313–4321 (1992). [DOI] [PMC free article] [PubMed] [Google Scholar]
- 6.Bennett SR et al. Help for cytotoxic-T-cell responses is mediated by CD40 signalling. Nature 393, 478–480 (1998). [DOI] [PubMed] [Google Scholar]
- 7.Schoenberger SP et al. T-cell help for cytotoxic T lymphocytes is mediated by CD40-CD40L interactions. Nature 393, 480–483 (1998). [DOI] [PubMed] [Google Scholar]
- 8.Ridge JP, Di Rosa F & Matzinger P A conditioned dendritic cell can be a temporal bridge between a CD4+ T-helper and a T-killer cell. Nature 393, 474–478 (1998). [DOI] [PubMed] [Google Scholar]
- 9.Bourgeois C, Rocha B & Tanchot C A role for CD40 expression on CD8+ T cells in the generation of CD8+ T cell memory. Science 297, 2060–2063 (2002). [DOI] [PubMed] [Google Scholar]
- 10.Lee BO, Hartson L & Randall TD CD40-deficient, influenza-specific CD8 memory T cells develop and function normally in a CD40-sufficient environment. J. Exp. Med 198, 1759–1764 (2003). [DOI] [PMC free article] [PubMed] [Google Scholar]
- 11.Sun JC & Bevan MJ Defective CD8 T cell memory following acute infection without CD4 T cell help. Science 300, 339–342 (2003). [DOI] [PMC free article] [PubMed] [Google Scholar]
- 12.Smith CM et al. Cognate CD4+ T cell licensing of dendritic cells in CD8+ T cell immunity. Nat. Immunol 5, 1143–1148 (2004). [DOI] [PubMed] [Google Scholar]
- 13.Eickhoff S et al. Robust anti-viral immunity requires multiple distinct T cell-dendritic cell interactions. Cell 162, 1322–1337 (2015). [DOI] [PMC free article] [PubMed] [Google Scholar]
- 14.Hor JL et al. Spatiotemporally distinct interactions with dendritic cell subsets facilitates CD4+ and CD8+ T cell activation to localized viral infection. Immunity 43, 554–565 (2015). [DOI] [PubMed] [Google Scholar]
- 15.Hildner K et al. Batf3 deficiency reveals a critical role for CD8alpha+ dendritic cells in cytotoxic T cell immunity. Science 322, 1097–1100 (2008). [DOI] [PMC free article] [PubMed] [Google Scholar]
- 16.Theisen DJ et al. WDFY4 is required for cross-presentation in response to viral and tumor antigens. Science 362, 694–699 (2018). [DOI] [PMC free article] [PubMed] [Google Scholar]
- 17.Ferris ST et al. cDC1 prime and are licensed by CD4+ T cells to induce anti-tumour immunity. Nature 584, 624–629 (2020). [DOI] [PMC free article] [PubMed] [Google Scholar]
- 18.Kawabe T et al. The immune responses in CD40-deficient mice: impaired immunoglobulin class switching and germinal center formation. Immunity 1, 167–178 (1994). [DOI] [PubMed] [Google Scholar]
- 19.Renshaw BR et al. Humoral immune responses in CD40 ligand-deficient mice. J. Exp. Med 180, 1889–1900 (1994). [DOI] [PMC free article] [PubMed] [Google Scholar]
- 20.Xu J et al. Mice deficient for the CD40 ligand. Immunity 1, 423–431 (1994). [DOI] [PubMed] [Google Scholar]
- 21.Ahonen C et al. The CD40-TRAF6 axis controls affinity maturation and the generation of long-lived plasma cells. Nat. Immunol 3, 451–456 (2002). [DOI] [PMC free article] [PubMed] [Google Scholar]
- 22.Gallagher E et al. Kinase MEKK1 is required for CD40-dependent activation of the kinases Jnk and p38, germinal center formation, B cell proliferation and antibody production. Nat. Immunol 8, 57–63 (2007). [DOI] [PubMed] [Google Scholar]
- 23.Luo W, Weisel F & Shlomchik MJ B cell receptor and CD40 signaling are rewired for synergistic induction of the c-Myc transcription factor in germinal center B cells. Immunity 48, 313–326 (2018). [DOI] [PMC free article] [PubMed] [Google Scholar]
- 24.Laidlaw BJ & Cyster JG Transcriptional regulation of memory B cell differentiation. Nat. Rev. Immunol 21, 209–220 (2021). [DOI] [PMC free article] [PubMed] [Google Scholar]
- 25.Feau S et al. The CD4+ T-cell help signal is transmitted from APC to CD8+ T-cells via CD27-CD70 interactions. Nat. Commun 3, 948 (2012). [DOI] [PMC free article] [PubMed] [Google Scholar]
- 26.Borst J et al. CD4+ T cell help in cancer immunology and immunotherapy. Nat. Rev. Immunol 18, 635–647 (2018). [DOI] [PubMed] [Google Scholar]
- 27.Bullock TN & Yagita H Induction of CD70 on dendritic cells through CD40 or TLR stimulation contributes to the development of CD8+ T cell responses in the absence of CD4+ T cells. J. Immunol 174, 710–717 (2005). [DOI] [PubMed] [Google Scholar]
- 28.Ardouin L et al. Broad and largely concordant molecular changes characterize tolerogenic and immunogenic dendritic cell maturation in thymus and periphery. Immunity 45, 305–318 (2016). [DOI] [PubMed] [Google Scholar]
- 29.Munitic I et al. CD70 deficiency impairs effector CD8 T cell generation and viral clearance but is dispensable for the recall response to lymphocytic choriomeningitis virus. J. Immunol 190, 1169–1179 (2013). [DOI] [PMC free article] [PubMed] [Google Scholar]
- 30.Hendriks J et al. CD27 is required for generation and long-term maintenance of T cell immunity. Nat. Immunol 1, 433–440 (2000). [DOI] [PubMed] [Google Scholar]
- 31.Ahrends T et al. CD4+ T cell help confers a cytotoxic T cell effector program including coinhibitory receptor downregulation and increased tissue invasiveness. Immunity 47, 848–861 (2017). [DOI] [PubMed] [Google Scholar]
- 32.Oba T et al. A critical role of CD40 and CD70 signaling in conventional type 1 dendritic cells in expansion and antitumor efficacy of adoptively transferred tumor-specific T cells. J. Immunol 205, 1867–1877 (2020). [DOI] [PMC free article] [PubMed] [Google Scholar]
- 33.Theisen DJ et al. Batf3-dependent genes control tumor rejection induced by dendritic cells independently of cross-presentation. Cancer Immunol. Res 7, 29–39 (2019). [DOI] [PubMed] [Google Scholar]
- 34.Zelenay S et al. Cyclooxygenase-dependent tumor growth through evasion of immunity. Cell 162, 1257–1270 (2015). [DOI] [PMC free article] [PubMed] [Google Scholar]
- 35.Ishikawa TO & Herschman HR Conditional knockout mouse for tissue-specific disruption of the cyclooxygenase-2 (Cox-2) gene. Genesis 44, 143–149 (2006). [DOI] [PubMed] [Google Scholar]
- 36.Ruhland MK et al. Visualizing synaptic transfer of tumor antigens among dendritic cells. Cancer Cell 37, 786–799 (2020). [DOI] [PMC free article] [PubMed] [Google Scholar]
- 37.Scharping NE et al. The tumor microenvironment represses T cell mitochondrial biogenesis to drive intratumoral T cell metabolic insufficiency and dysfunction. Immunity 45, 374–388 (2016). [DOI] [PMC free article] [PubMed] [Google Scholar]
- 38.Daniels NJ et al. Antigen-specific cytotoxic T lymphocytes target airway CD103+ and CD11b+ dendritic cells to suppress allergic inflammation. Mucosal Immunol. 9, 229–239 (2016). [DOI] [PubMed] [Google Scholar]
- 39.Darzynkiewicz Z et al. Fluorochrome-labeled inhibitors of caspases: expedient in vitro and in vivo markers of apoptotic cells for rapid cytometric analysis. Methods Mol. Biol 1644, 61–73 (2017). [DOI] [PubMed] [Google Scholar]
- 40.Kim S et al. High amount of transcription factor IRF8 engages AP1-IRF composite elements in enhancers to direct type 1 conventional dendritic cell identity. Immunity 53, 1–16 (2020). [DOI] [PMC free article] [PubMed] [Google Scholar]
- 41.Zhang N & He YW The antiapoptotic protein Bcl-xL is dispensable for the development of effector and memory T lymphocytes. J. Immunol 174, 6967–6973 (2005). [DOI] [PubMed] [Google Scholar]
- 42.Ohl L et al. CCR7 governs skin dendritic cell migration under inflammatory and steady-state conditions. Immunity 21, 279–288 (2004). [DOI] [PubMed] [Google Scholar]
- 43.Ryan EP et al. Activated human B lymphocytes express cyclooxygenase-2 and cyclooxygenase inhibitors attenuate antibody production. J. Immunol 174, 2619–2626 (2005). [DOI] [PubMed] [Google Scholar]
- 44.Remes Lenicov F et al. Prostaglandin E2 antagonizes TGF-beta actions during the differentiation of monocytes into dendritic cells. Front Immunol. 9, 1441 (2018). [DOI] [PMC free article] [PubMed] [Google Scholar]
- 45.Krause P et al. Prostaglandin E(2) enhances T-cell proliferation by inducing the costimulatory molecules OX40L, CD70, and 4-1BBL on dendritic cells. Blood 113, 2451–2460 (2009). [DOI] [PubMed] [Google Scholar]
- 46.Sreeramkumar V, Fresno M & Cuesta N Prostaglandin E2 and T cells: friends or foes? Immunol. Cell Biol 90, 579–586 (2012). [DOI] [PMC free article] [PubMed] [Google Scholar]
- 47.Yu Y et al. Targeted cyclooxygenase gene (ptgs) exchange reveals discriminant isoform functionality. J. Biol. Chem 282, 1498–1506 (2007). [DOI] [PubMed] [Google Scholar]
- 48.Matsue H et al. Dendritic cells undergo rapid apoptosis in vitro during antigen-specific interaction with CD4+ T cells. J. Immunol 162, 5287–5298 (1999). [PubMed] [Google Scholar]
- 49.Bjorck P, Banchereau J & Flores-Romo L CD40 ligation counteracts Fas-induced apoptosis of human dendritic cells. Int Immunol. 9, 365–372 (1997). [DOI] [PubMed] [Google Scholar]
- 50.Lundqvist A et al. Mature dendritic cells are protected from Fas/CD95-mediated apoptosis by upregulation of Bcl-X(L). Cancer Immunol. Immunother 51, 139–144 (2002). [DOI] [PMC free article] [PubMed] [Google Scholar]
- 51.Miga AJ et al. Dendritic cell longevity and T cell persistence is controlled by CD154-CD40 interactions. Eur. J. Immunol 31, 959–965 (2001). [DOI] [PubMed] [Google Scholar]
- 52.Riol-Blanco L et al. Immunological synapse formation inhibits, via NF-kappaB and FOXO1, the apoptosis of dendritic cells. Nat. Immunol 10, 753–760 (2009). [DOI] [PubMed] [Google Scholar]
- 53.Chen M et al. Dendritic cell apoptosis in the maintenance of immune tolerance. Science 311, 1160–1164 (2006). [DOI] [PubMed] [Google Scholar]
- 54.Chen M et al. Regulation of the lifespan in dendritic cell subsets. Mol. Immunol 44, 2558–2565 (2007). [DOI] [PMC free article] [PubMed] [Google Scholar]
- 55.Chen M, Huang L & Wang J Deficiency of Bim in dendritic cells contributes to overactivation of lymphocytes and autoimmunity. Blood 109, 4360–4367 (2007). [DOI] [PMC free article] [PubMed] [Google Scholar]
- 56.Zhang X et al. Up-regulation of Bcl-xL expression protects CD40-activated human B cells from Fas-mediated apoptosis. Cell Immunol. 173, 149–154 (1996). [DOI] [PubMed] [Google Scholar]
- 57.Grillot DAM et al. bcl-x exhibits regulated expression during B cell development and activation and modulates lymphocyte survival in transgenic mice. J. Exp. Med 183, 381–391 (1996). [DOI] [PMC free article] [PubMed] [Google Scholar]
- 58.Chao DT & Korsmeyer SJ BCL-2 family: regulators of cell death. Annu. Rev. Immunol 16, 395–419 (1998). [DOI] [PubMed] [Google Scholar]
- 59.Nopora K et al. MHC class I cross-presentation by dendritic cells counteracts viral immune evasion. Front Immunol. 3, 348 (2012). [DOI] [PMC free article] [PubMed] [Google Scholar]
- 60.Pirtskhalaishvili G et al. Cytokine-mediated protection of human dendritic cells from prostate cancer-induced apoptosis is regulated by the Bcl-2 family of proteins. Br. J. Cancer 83, 506–513 (2000). [DOI] [PMC free article] [PubMed] [Google Scholar]
- 61.Pirtskhalaishvili G et al. Transduction of dendritic cells with Bcl-xL increases their resistance to prostate cancer-induced apoptosis and antitumor effect in mice. J. Immunol 165, 1956–1964 (2000). [DOI] [PubMed] [Google Scholar]
- 62.Borrow P et al. CD40L-deficient mice show deficits in antiviral immunity and have an impaired memory CD8+ CTL response. J. Exp. Med 183, 2129–2142 (1996). [DOI] [PMC free article] [PubMed] [Google Scholar]
- 63.Borrow P et al. CD40 ligand-mediated interactions are involved in the generation of memory CD8+ cytotoxic T lymphocytes (CTL) but are not required for the maintenance of CTL memory following virus infection. J. Virol 72, 7440–7449 (1998). [DOI] [PMC free article] [PubMed] [Google Scholar]
- 64.Hernandez MG, Shen L & Rock KL CD40 on APCs is needed for optimal programming, maintenance, and recall of CD8+ T cell memory even in the absence of CD4+ T cell help. J. Immunol 180, 4382–4390 (2008). [DOI] [PubMed] [Google Scholar]
- 65.Taraban VY et al. Requirement for CD70 in CD4+ Th cell-dependent and innate receptor-mediated CD8+ T cell priming. J. Immunol 177, 2969–2975 (2006). [DOI] [PubMed] [Google Scholar]
- 66.Ahrends T et al. CD27 agonism plus PD-1 blockade recapitulates CD4+ T-cell help in therapeutic anticancer vaccination. Cancer Res. 76, 2921–2931 (2016). [DOI] [PubMed] [Google Scholar]
- 67.Lybarger L et al. Virus subversion of the MHC class I peptide-loading complex. Immunity 18, 121–130 (2003). [DOI] [PubMed] [Google Scholar]
- 68.Diamond MS et al. Type I interferon is selectively required by dendritic cells for immune rejection of tumors. J. Exp. Med 208, 1989–2003 (2011). [DOI] [PMC free article] [PubMed] [Google Scholar]
- 69.Koebel CM et al. Adaptive immunity maintains occult cancer in an equilibrium state. Nature 450, 903–907 (2007). [DOI] [PubMed] [Google Scholar]
- 70.Toebes M et al. Design and use of conditional MHC class I ligands. Nat. Med 12, 246–251 (2006). [DOI] [PubMed] [Google Scholar]
- 71.Andersen RS et al. Parallel detection of antigen-specific T cell responses by combinatorial encoding of MHC multimers. Nat. Protoc 7, 891–902 (2012). [DOI] [PubMed] [Google Scholar]
- 72.Kretzer NM et al. RAB43 facilitates cross-presentation of cell-associated antigens by CD8alpha + dendritic cells. J. Exp. Med 213, 2871–2883 (2016). [DOI] [PMC free article] [PubMed] [Google Scholar]
- 73.Ouyang W et al. Inhibition of Th1 development mediated by GATA-3 through an IL-4-independent mechanism. Immunity 9, 745–755 (1998). [DOI] [PubMed] [Google Scholar]
- 74.Cheng EH et al. BCL-2, BCL-X(L) sequester BH3 domain-only molecules preventing BAX- and BAK-mediated mitochondrial apoptosis. Mol. Cell 8, 705–711 (2001). [DOI] [PubMed] [Google Scholar]
- 75.Choi K et al. A common precursor for hematopoietic and endothelial cells. Development 125, 725–732 (1998). [DOI] [PubMed] [Google Scholar]
- 76.Anderson DA III et al. The MYCL and MXD1 transcription factors regulate the fitness of murine dendritic cells. Proc. Natl Acad. Sci. USA 117, 4885–4893 (2020). [DOI] [PMC free article] [PubMed] [Google Scholar]
Associated Data
This section collects any data citations, data availability statements, or supplementary materials included in this article.
Data Availability Statement
Microarray data generated in the current study are available in the Gene Expression Omnibus database with the accession number GSE211426. Source data are provided with this paper.