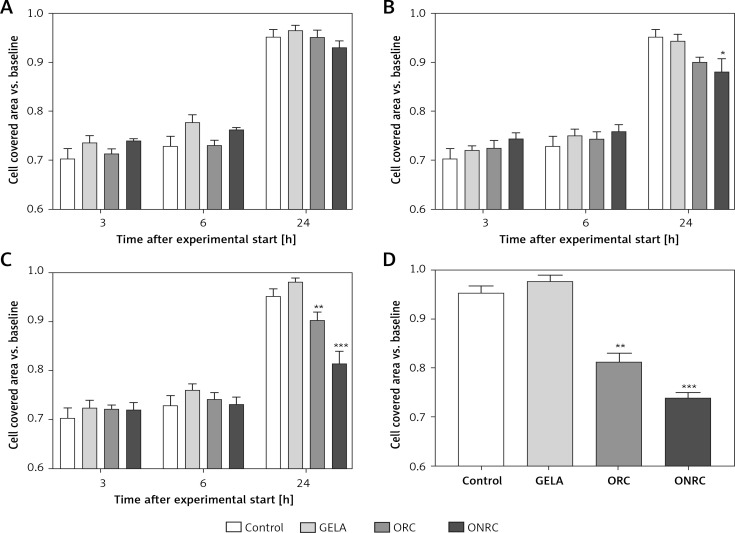
Figure 4.
Fibroblast migration time course after different exposure times to hemostats. Human stromal fibroblasts were placed in both chambers of a μ-dish insert. After removal of the μ-dish insert the area between the cell fractions was measured at baseline. Hemostats were applied to the cell culture medium for 5–10 (A), 30 (B), or 60 minutes (min) (C) or continuously over 24 hours (h) (D). The area between the two cell fractions was measured after 3, 6 and 24 h from representative images. Impaired cell migration was observed for ORC/ONRC vs. GELA/control and for ORC vs. ONRC for 60 min and 24 h of exposure (C and D). *p < 0.05 vs. control; **p < 0.05 vs. control and GELA; ***p < 0.05 vs. control, GELA and ORC. Two-way ANOVA with 2-stage step-up method of Benjamini, Krieger and Yekutieli was applied (q = 0.05, n = 5–7/experimental group)

