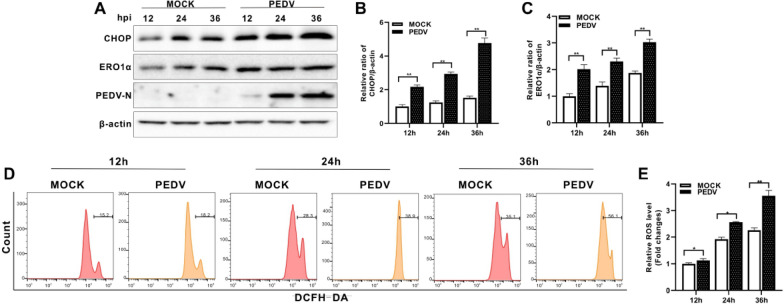
Figure 1.
PEDV infection increased the levels of CHOP and ERO1α expression and cytosolic ROS. Vero E6 cells were infected with PEDV (MOI = 0.001) or mock infected for indicated time points. A Western blotting of CHOP and ERO1α. β-actin was used as loading control. B Ratios of CHOP to β-actin. C Ratios of ERO1α to β-actin. D Cells were measured for changes in ROS level by flow cytometry after incubation with 10 μM DCFH-DA for 30 min at 37 °C. E The changes in cytosolic ROS levels were evaluated according to the mean value of DCFH-DA fluorescence intensity and expressed as fold changes between mock- and PEDV-infected cells. The bar charts in B, C, and E represent mean ± SD of three independent experiments. *, P < 0.05; **, P < 0.01.

