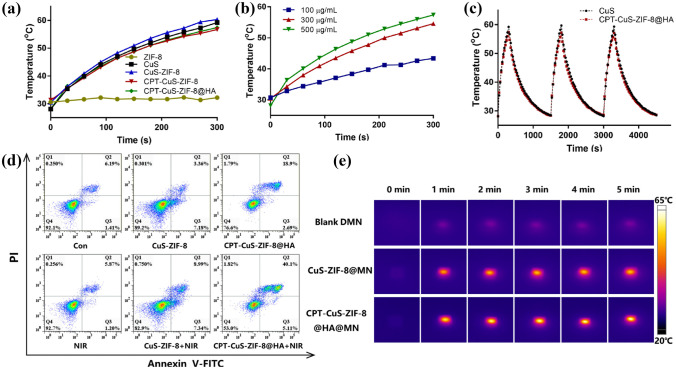
Fig. 3.
Schematic diagram of temperature change of MN PTT loaded with metal photosensitizers. a Temperature change curves of CPT-CuS-ZIF-8@HA, CPT-CuS-ZIF-8, CuS-ZIF-8, CuS, and ZIF-8 under laser irradiation (1.0 W/cm2) at different time points. b Temperature change curves of CPT-CuS-ZIF-8@HA at different concentrations under NIR irradiation. c Photothermal conversion stability curves of CuS and CPT-CuS-ZIF-8@HA for three cycles. d Schematic diagram of apoptosis analysis. e The thermographic images of blank DMN, CuS-ZIF-8@MN, and CPT-CuS-ZIF-8@HA@MN under NIR irradiation at different time points [94].
Copyright 2021 Elsevier

