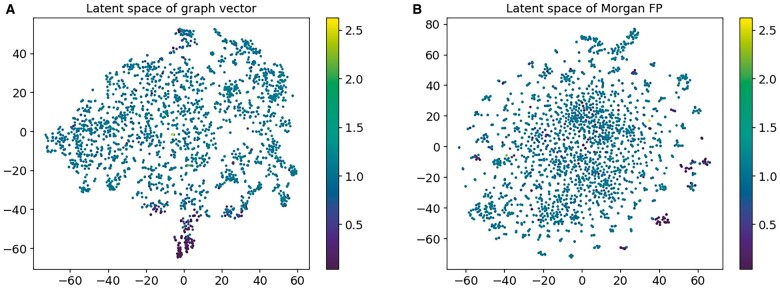
Fig. 2.
Comparison of the latent space learned by the encoder–predictor and the latent space corresponding to the Morgan fingerprint. (A) Learned by the encoder–predictor. (B) Calculated using Morgan fingerprints. The value of the color bar represents the strength of antibacterial activity, the stronger the antibacterial activity, the smaller the value

