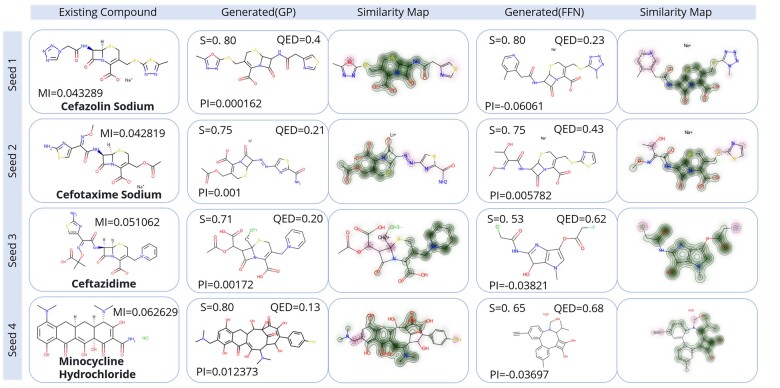
Fig. 4.
Sample results for potent antibiotic generation. Each row corresponds to the result of a seed. The molecules in the first column are the seeds, and MI is the Mean_Inhibition value of the experiment. The molecule in the second column is the molecule obtained by the GP fitness function and the molecule in the fourth column is the molecule obtained by the FFN fitness function. S is the Tanimoto similarity between the molecule and the corresponding seed, QED is the drug-like property of the molecule and PI is the predicted inhibition value. The third and fifth columns are the similarity maps between the molecules in the second and fourth columns and the corresponding seeds. The darker the color is, the more similar the substructure of the molecule and the seed is. The first column in bold is the name of each antibiotic molecule

