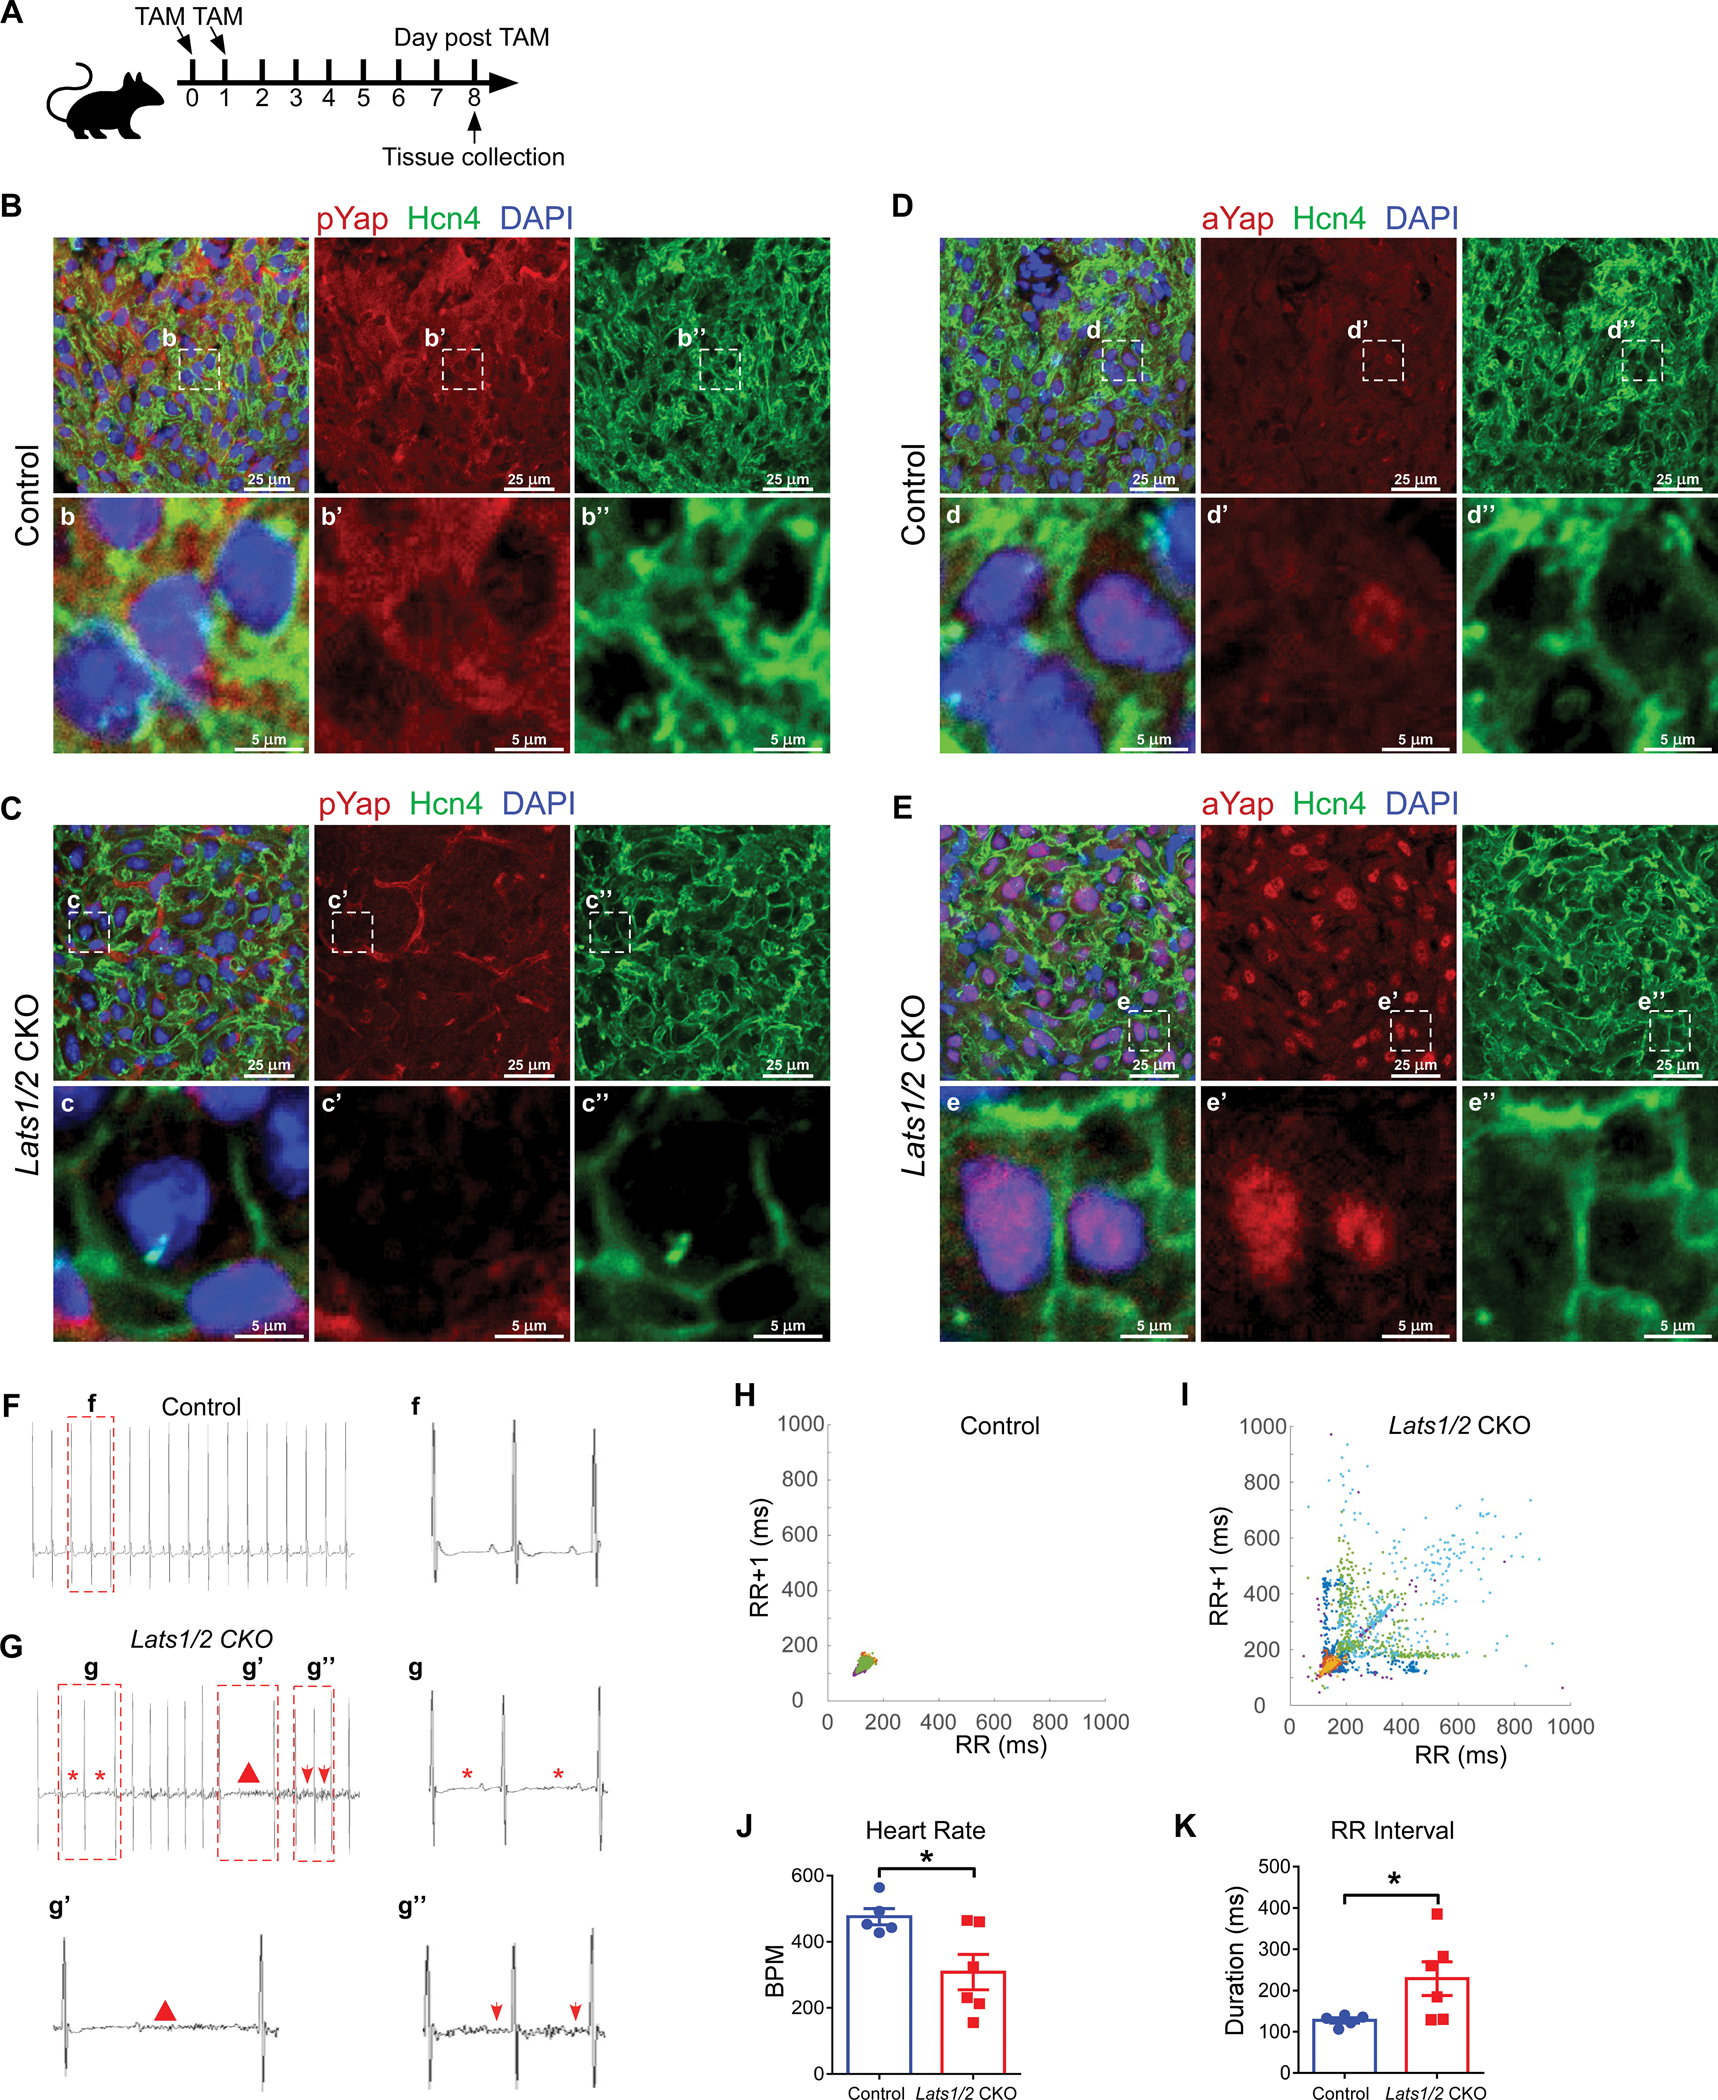
Figure 1. Inducible cardiac conduction system (CCS)-specific Lats1/2 deletion induces cardiac arrhythmias.

A. Experimental strategy for CCS-specific Cre activation and tissue collection. Cre activity was induced with 2 consecutive intraperitoneal injections of tamoxifen. B-C. Representative images of immunofluorescence staining of pYap in the SAN after tamoxifen induction in control (B) and Lats1/2 CKO (C) mice. Hcn4 (green) was used to label pacemaker cells (PCs) in the SAN. pYap (red) is an indicator of Hippo signaling activity. Nuclei were labeled with DAPI (blue). Lower panels show higher-magnification views of the boxed areas in the upper panels. Scale bar, 25 μm and 5 μm. D-E. Representative images of immunofluorescence staining of aYap in the SAN after tamoxifen induction in control (D) and Lats1/2 CKO (E) mice. aYap was stained with red; Hcn4 (green) was used to label PCs in SAN. Nuclei were labeled with DAPI (blue). Lower panels show higher-magnification views of the boxed areas in the upper panels Scale bar, 25 μm and 5 μm. F-G. Representative electrocardiogram (ECG) recordings in control and Lats1/2 CKO mice. Star, irregular RR intervals (g); triangle, AV blocks (g’); arrows, abnormal P waves (g”). H-I. Representative Poincaré plots showing beat-to-beat RR interval variability from control (n=5) and Lats1/2 CKO (n=6) mice. Each color represents individual RR/RR+1 intervals from a different mouse. J-K. Heart rates and RR intervals of control and Lats1/2 CKO mice. Control, n=5; Lats1/2 CKO, n=6. Data are shown as means ± s.e.m. Statistical significance was determined by t-test, *p<0.05.
