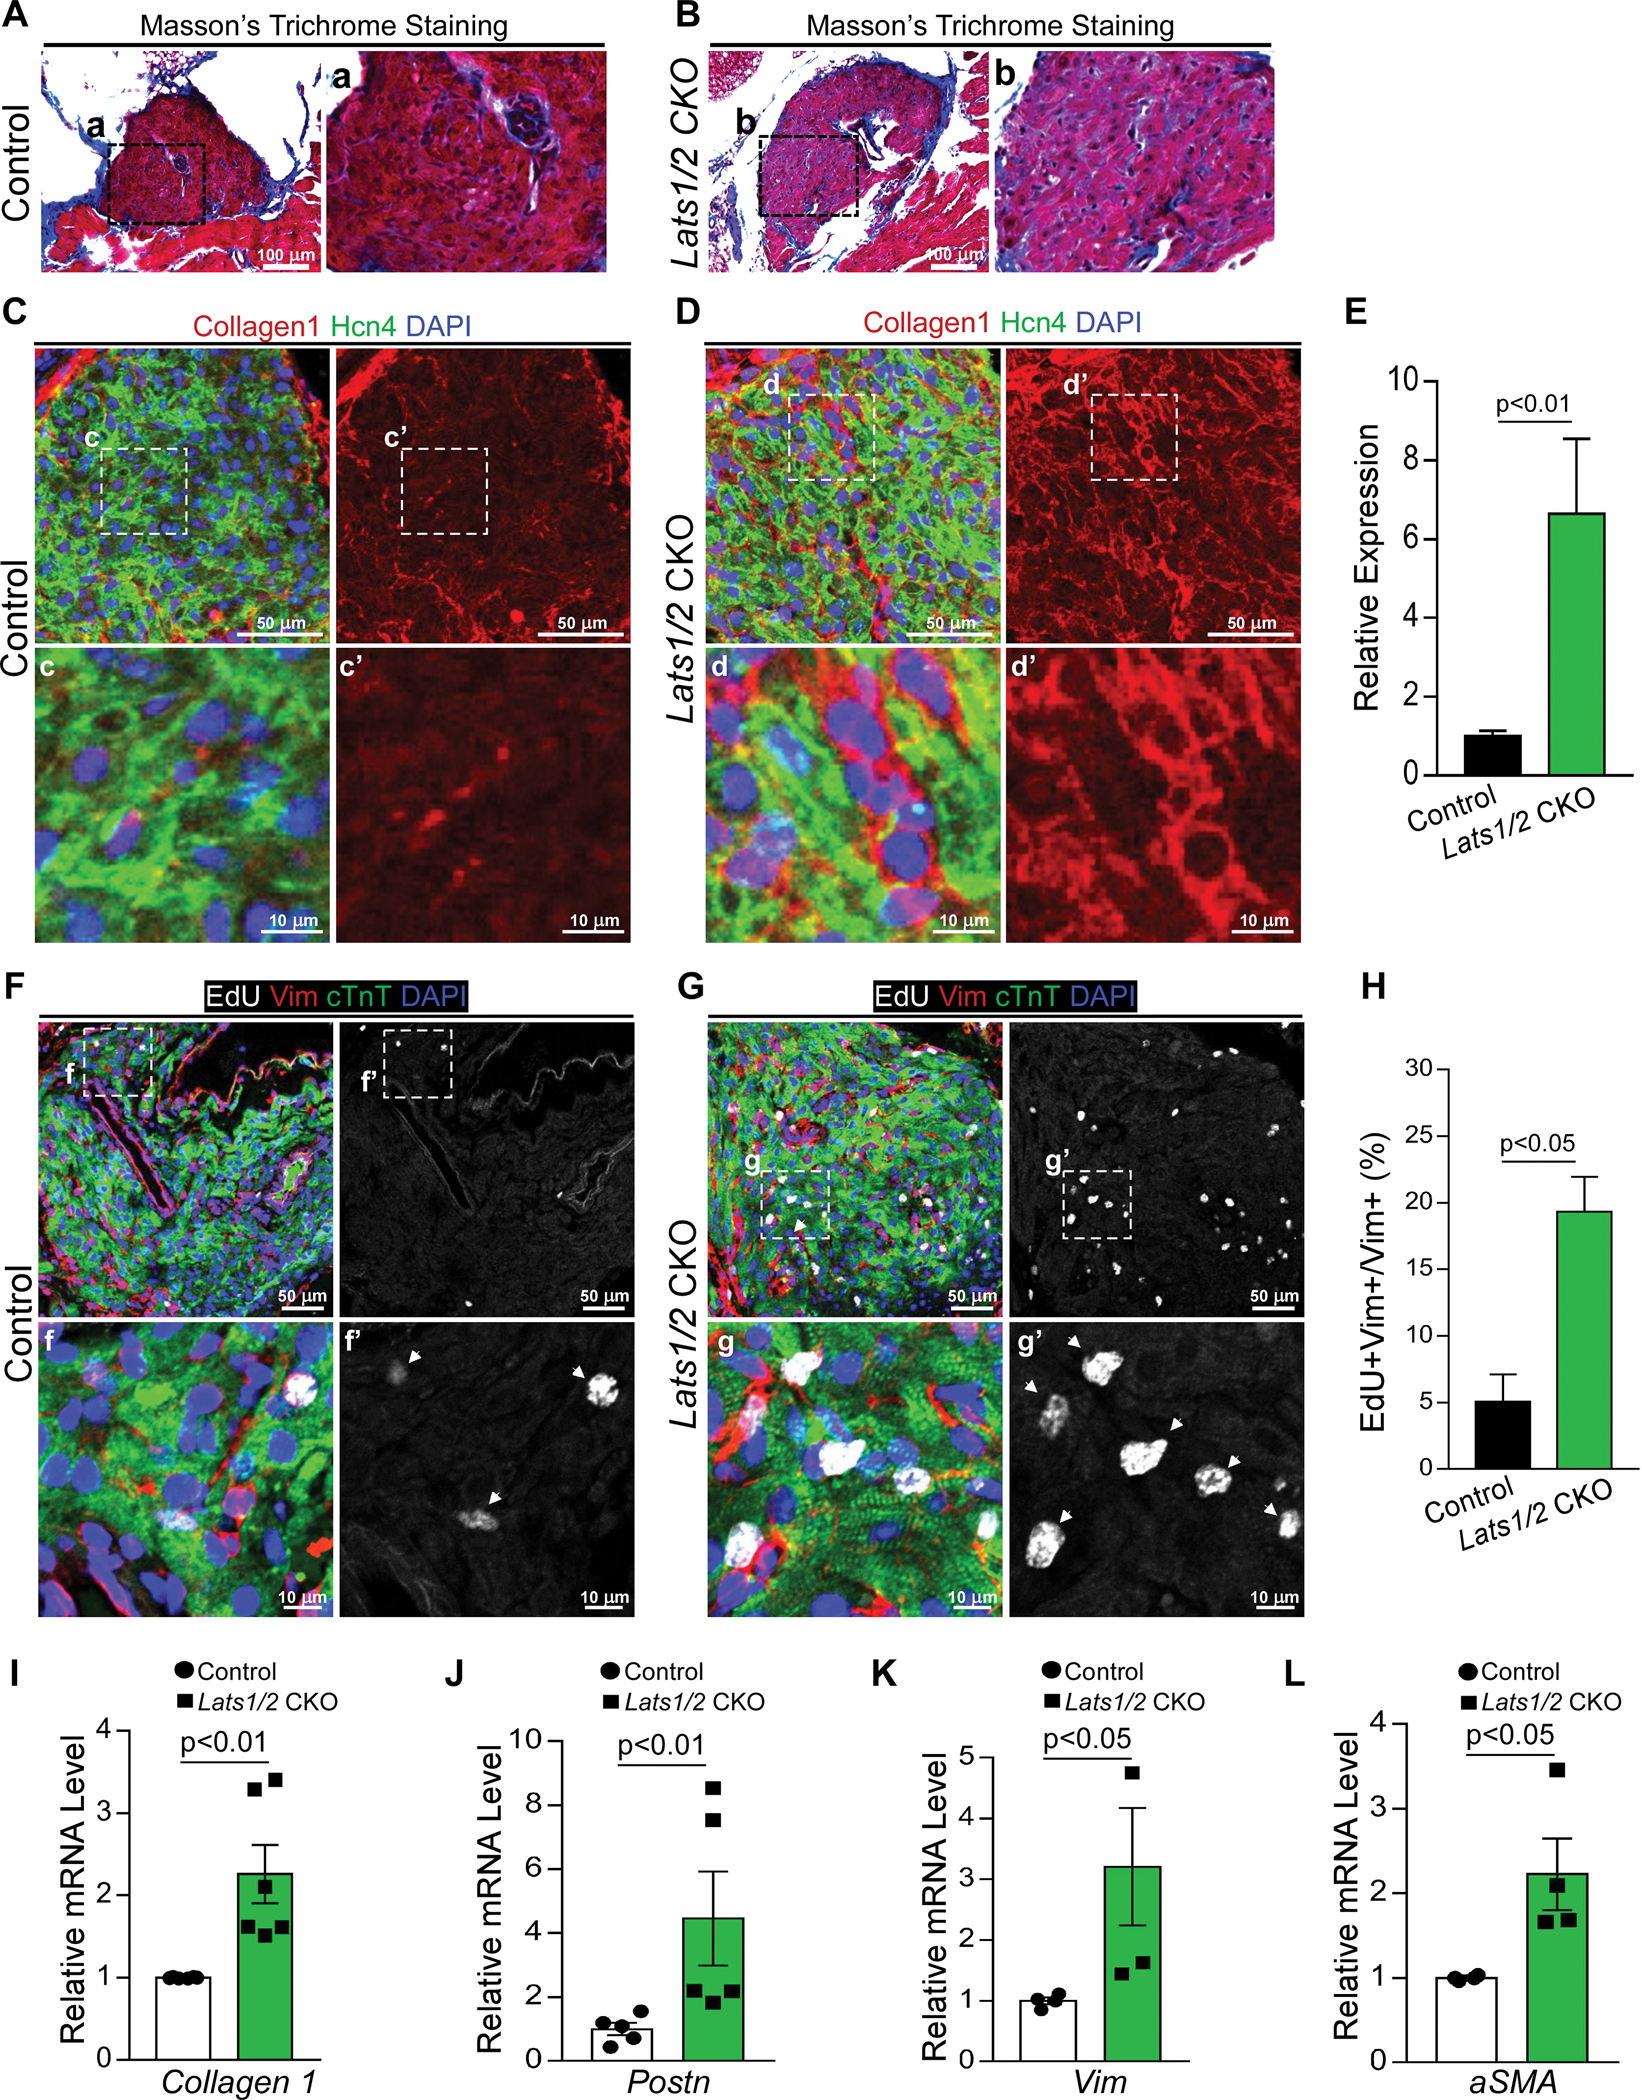
Figure 2. Lats1/2 deletion in CCS results in SAN fibrosis and fibroblast proliferation.

A-B. Masson’s Trichrome staining in control and Lats1/2 CKO SANs. Panels on the right show higher magnification of the boxed area from the panels on the left. Scale bar, 100 μm. C-E. Representative immunofluorescence confocal images from control (C) and Lats1/2 CKO (D) SANs after Hcn4-Cre activation showing collagens (Col1a1, red), PCs (Hcn4, green), and nuclei labeling (DAPI, blue). Panels on the right show higher magnification of the boxed area in panels on the left. Collagen 1 quantification (E), measured by pixel intensity. Data in (E) represent means ± s.e.m; statistical significance was determined by Mann–Whitney test. Scale bar, 25 μm and 5 μm. F-H. Representative images of EdU-labeled control (F) and Lats1/2 CKO (G) SANs. Samples were pulse-chased with EdU (white); fibroblasts and PCs were labeled with vimentin (red) and cTnT (green) respectively. Nuclei were stained with DAPI (blue). Arrows point to EdU-positive cells. Panels on the right show higher magnification of the boxed area in panels on the left. (H) Quantification of fibroblast proliferation. Representative image of proliferating fibroblast cells shown in F and G. Statistical significance was determined using the Mann–Whitney test (P<0.05). Scale bar, 25 μm and 5 μm. I-L. Quantitative real-time polymerase chain reaction validation of Collagen 1 (I), Periostin (Postn) (J), Vimentin (Vim) (K), and Acta2 (α-SMA) (L) in control and Lats1/2 CKO SANs. Each dot represents an independent biological replicate (n≥4). Data are shown as means ± s.e.m. Statistical significance was determined by Mann–Whitney test.
