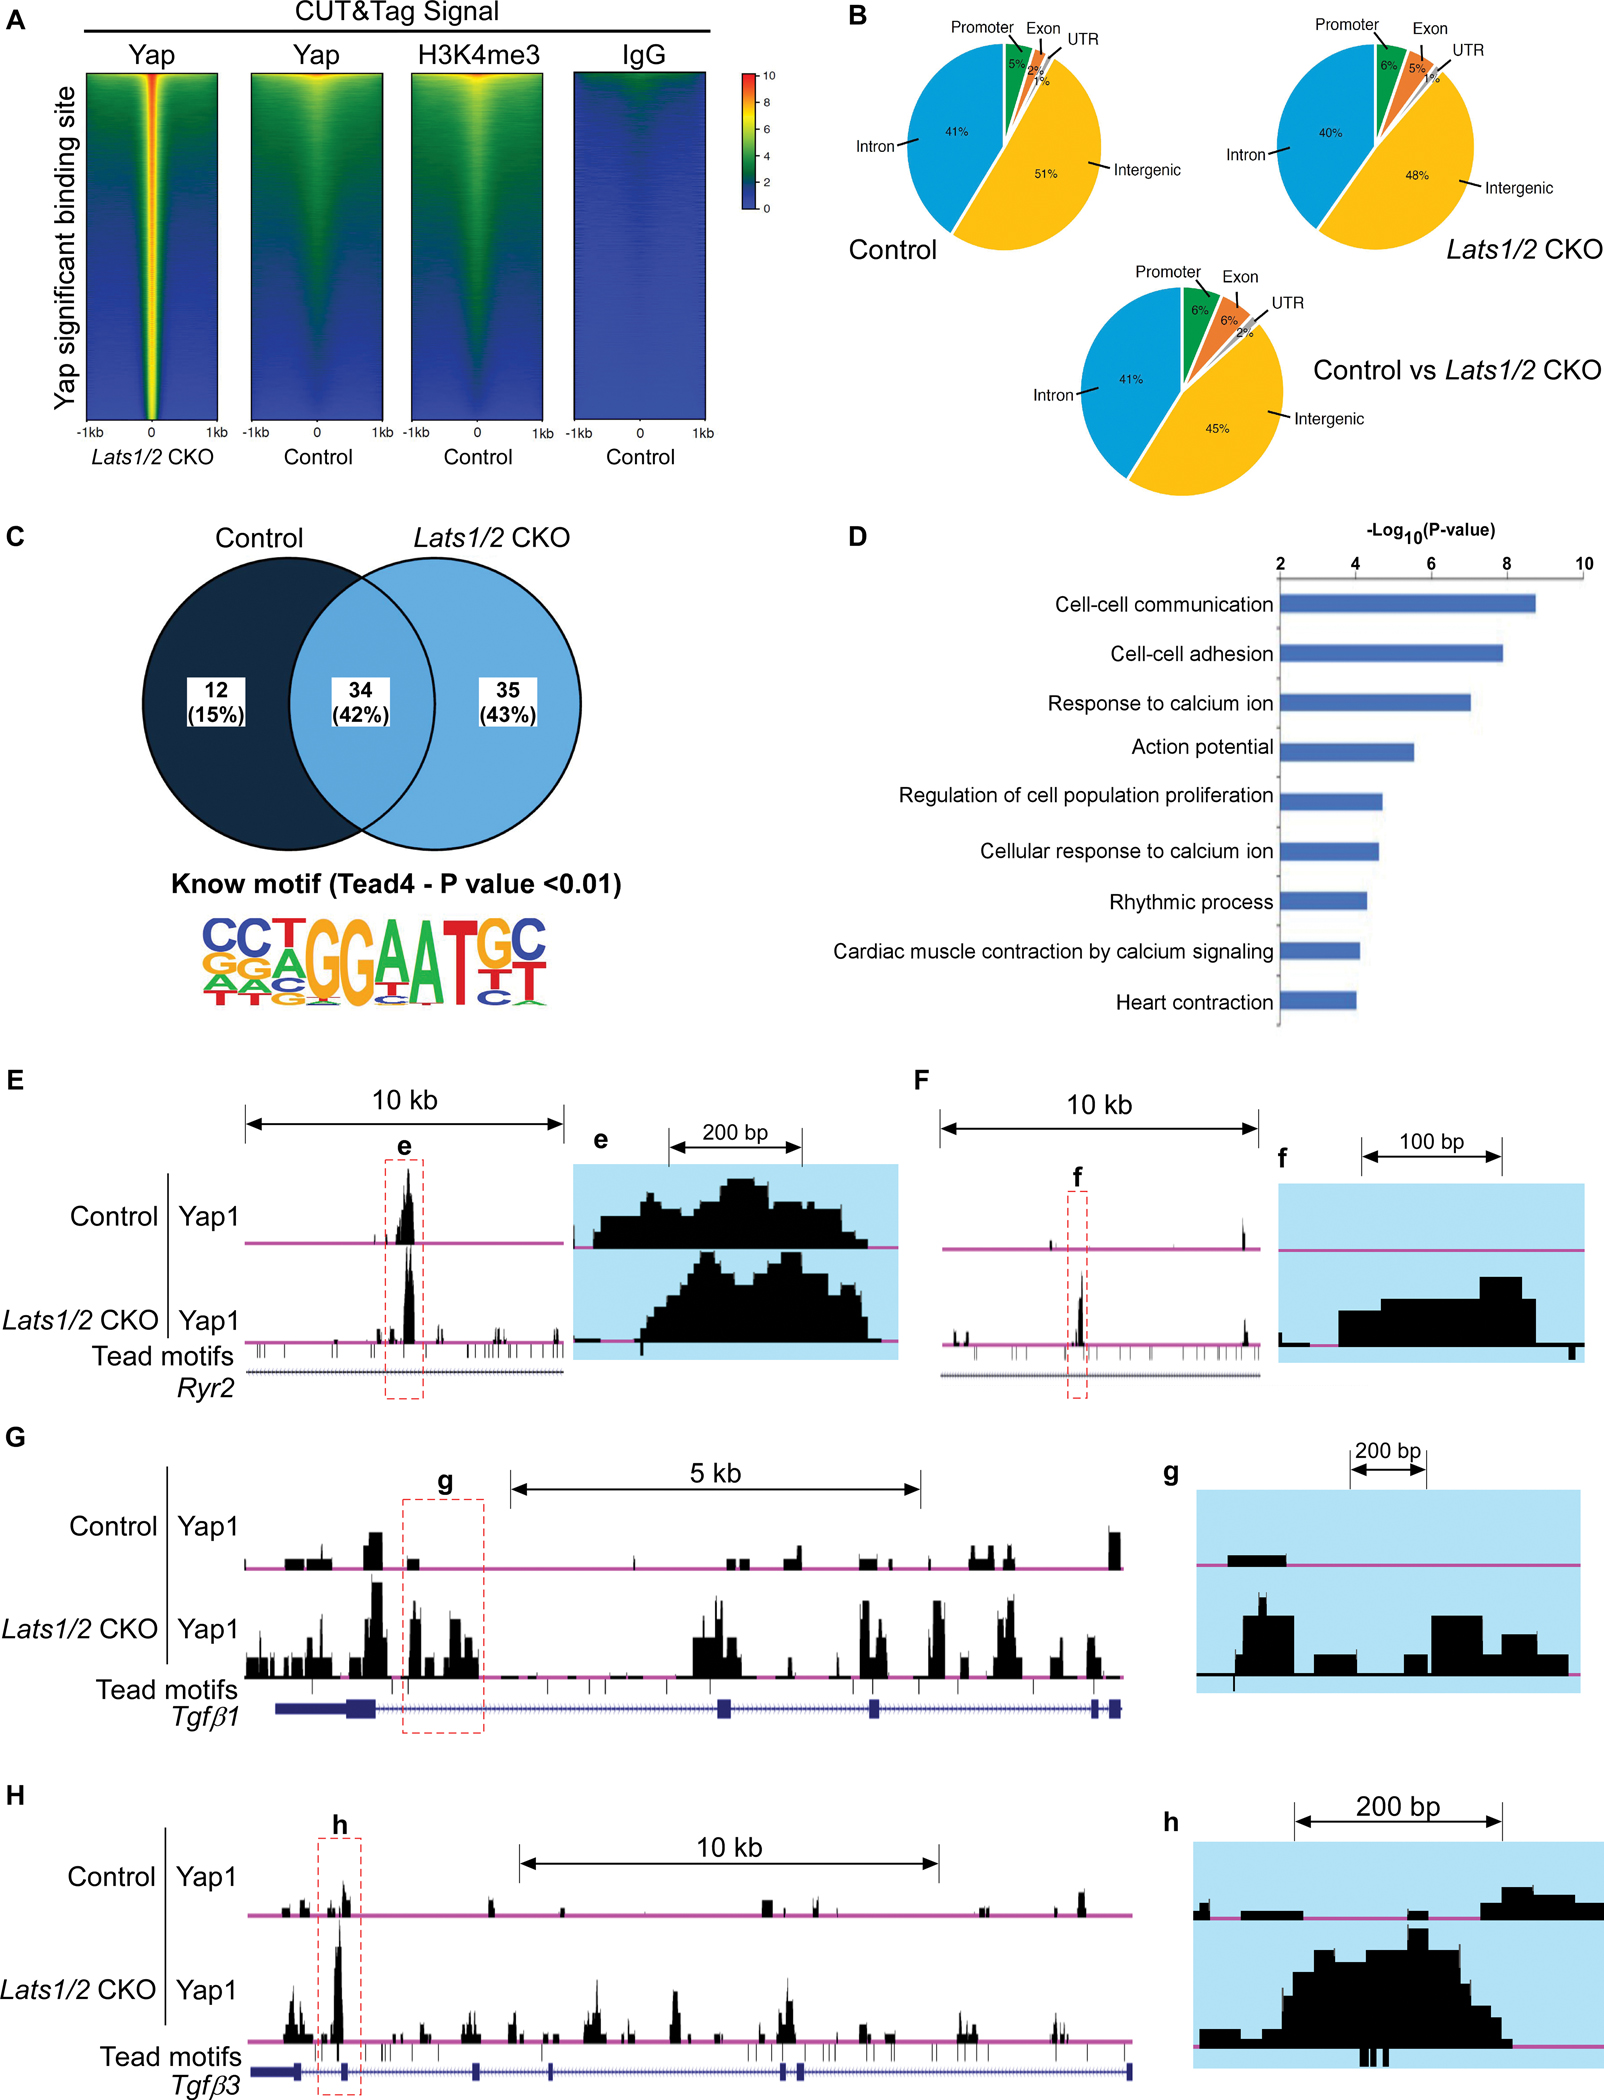
Figure 6. Analysis of CUT&Tag sequencing data.

A. Heatmap showing DNA binding peaks determined by CUT&Tag sequencing with Yap, IgG, and H3K4me3 in control and Lats1/2 CKO SANs. Quantification of CUT&Tag enrichment signal by ±1 kb to the center of Yap-associated regions. B. Distribution of Yap-associated regions. C. Motif analysis. The upper panel shows the percentage of identified binding sites containing the consensus binding motif(s). HOMER software was used to identify known motifs underneath Yap1 CUT&Tag peaks. The Tead4 consensus motif (the lower panel) was highly enriched and was represented as a sequence logo position weight matrix. D. Gene ontology (GO) analysis of direct targets of Yap. E-H. UCSC genome browser view of Yap CUT&Tag enriched peaks for the labeled genes. Larger peaks were seen in Lats1/2 CKO. Tead (TEA domain) motifs were also aligned.
