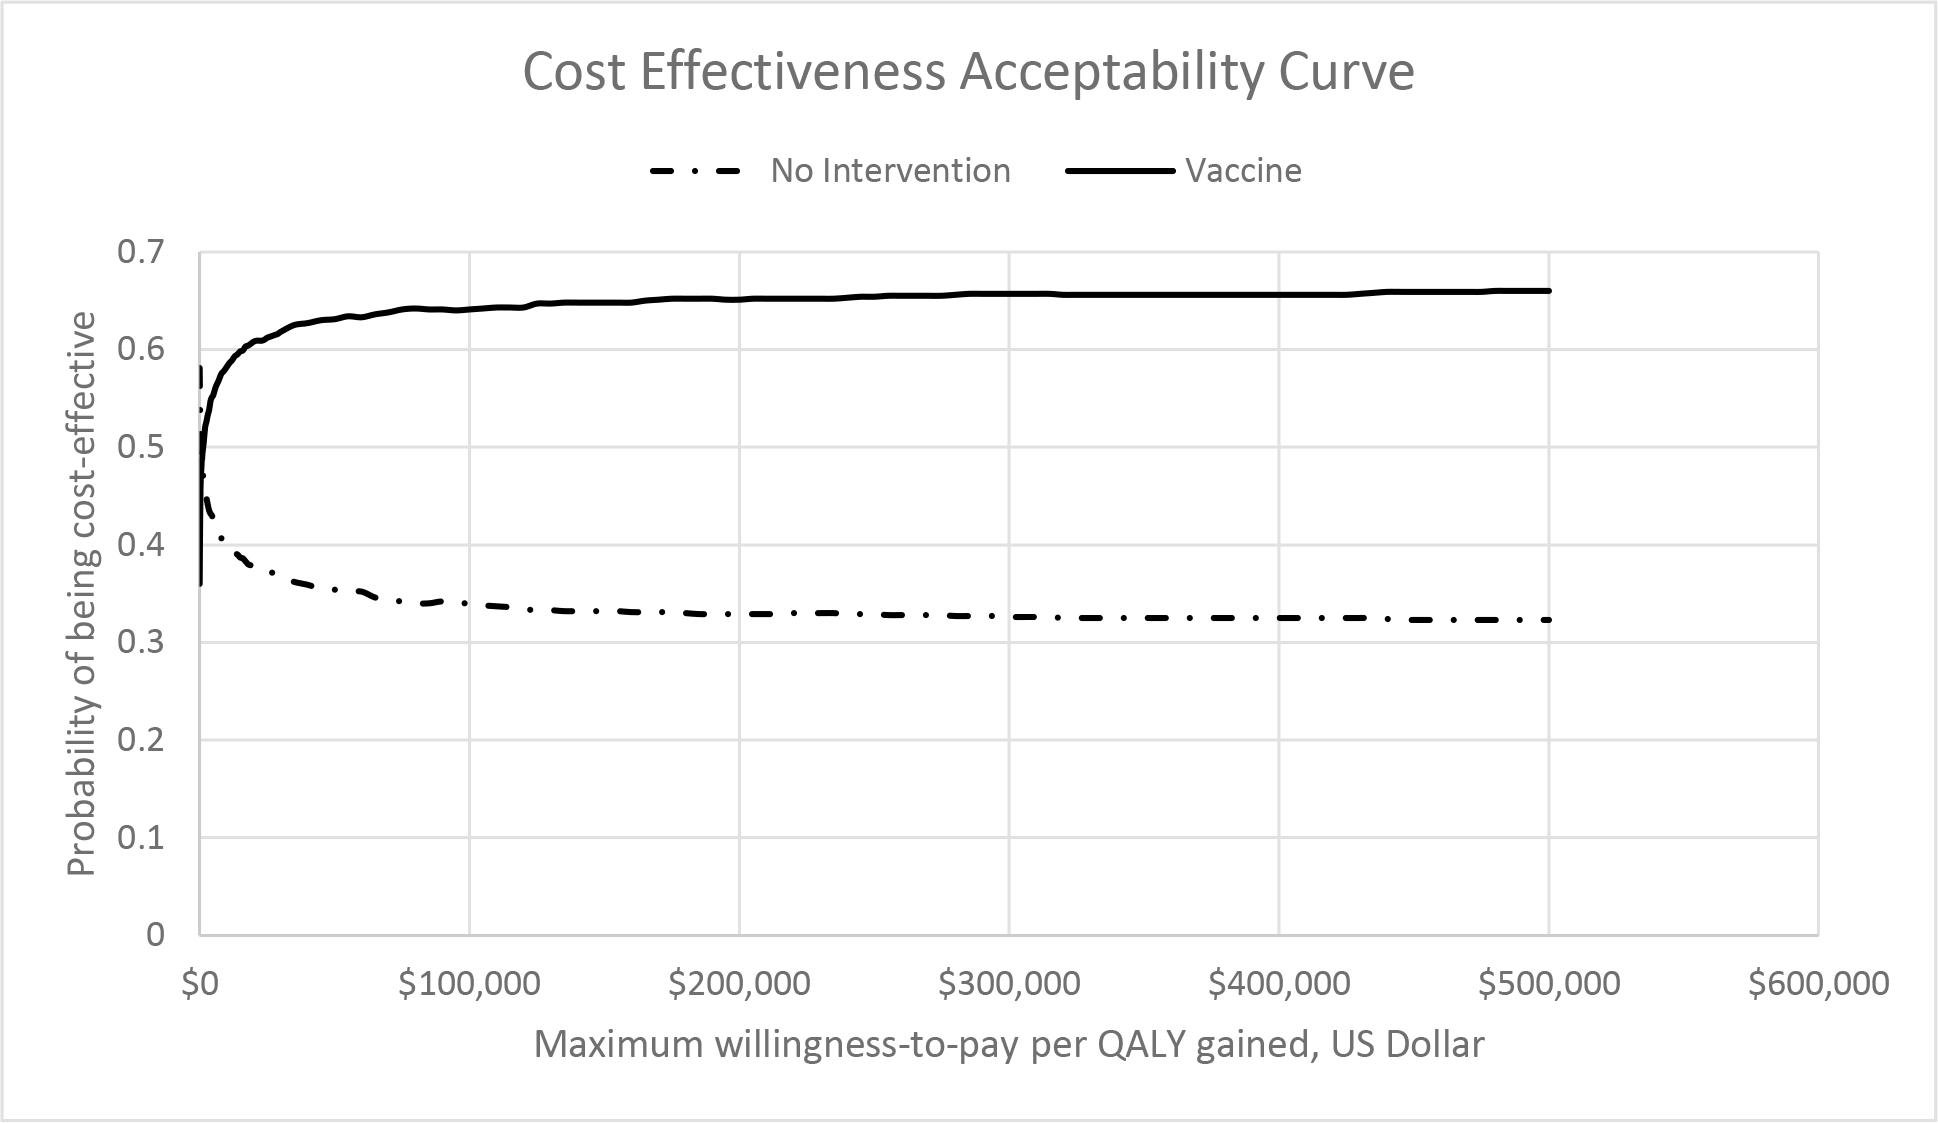
Figure 3.

Cost-effectiveness acceptability curve of the probability that a comparator is cost-effective at a given cost-effectiveness threshold, based on results of a probabilistic sensitivity analysis of 10,000 Monte Carlo simulations.
Definitions: QALY, quality-adjusted life year.
