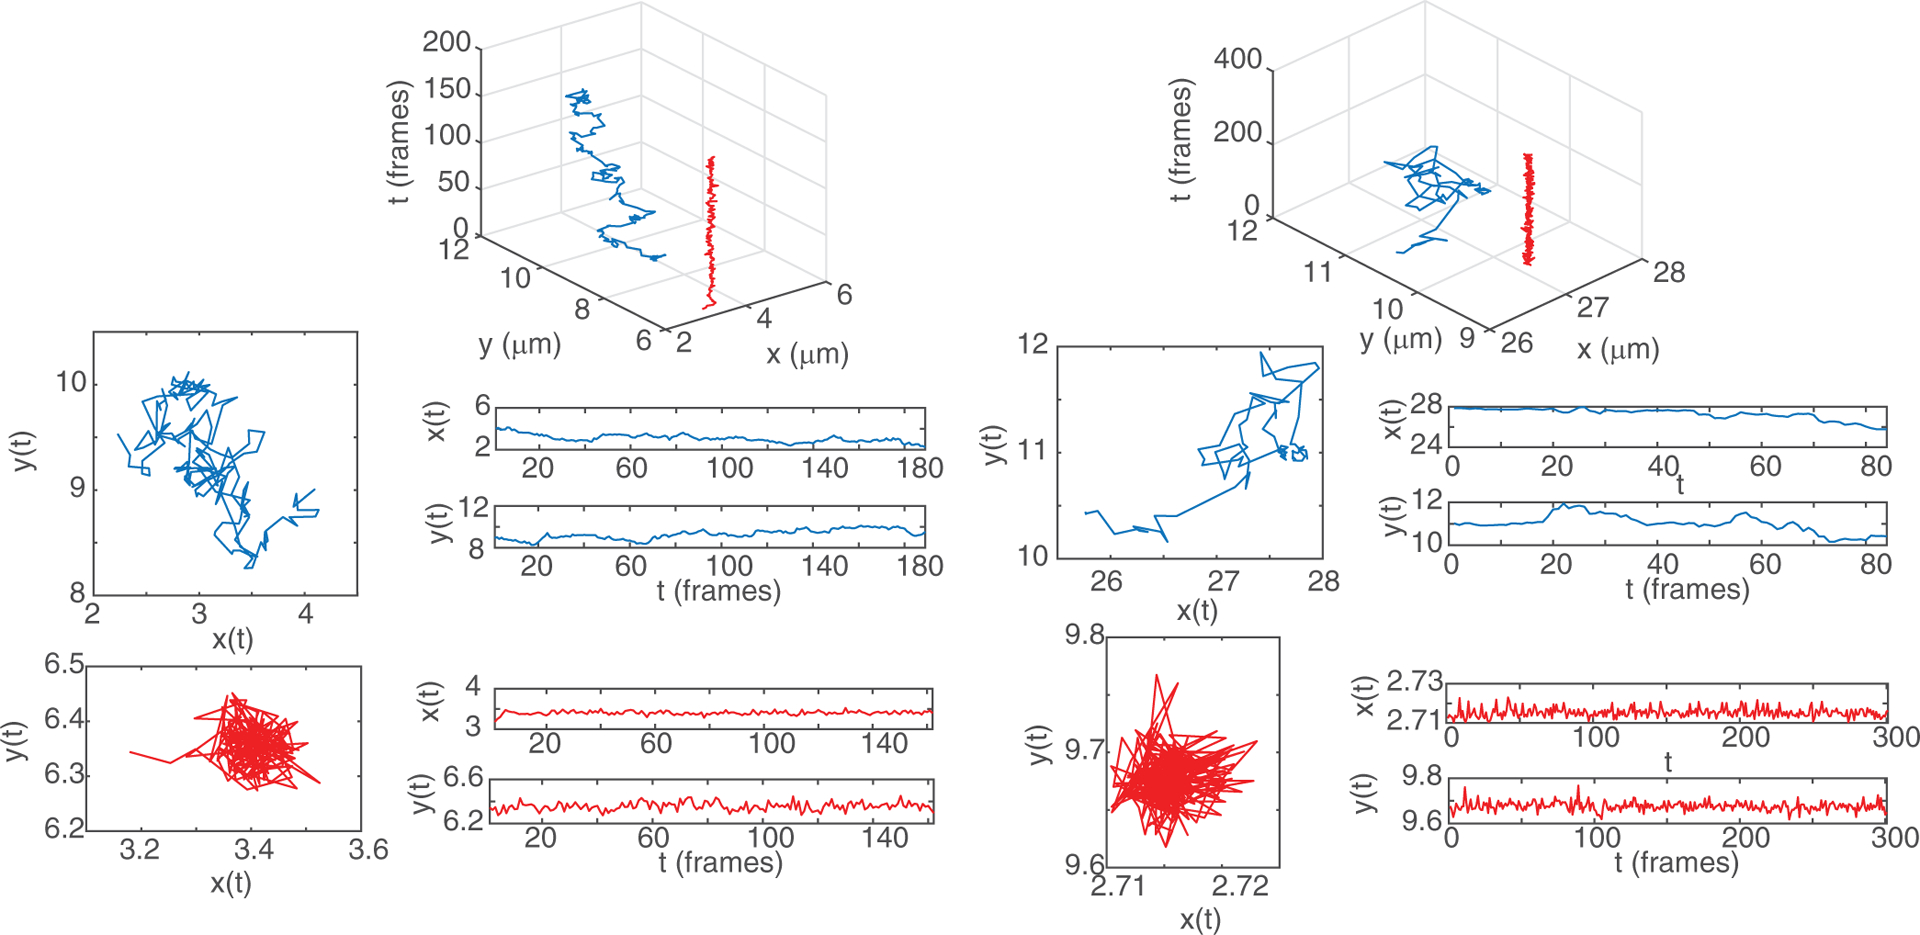
FIG. 1.

Representative Nav1.6 (left panel) and beta-2 receptor (right panel) trajectories. The top panel illustrates the receptor dynamics in three dimensions, where the z axis corresponds to time. The (upper) blue trajectories show molecules in the free state and the (lower) red trajectories show molecules in the confined state.
