
FIGURE 2.
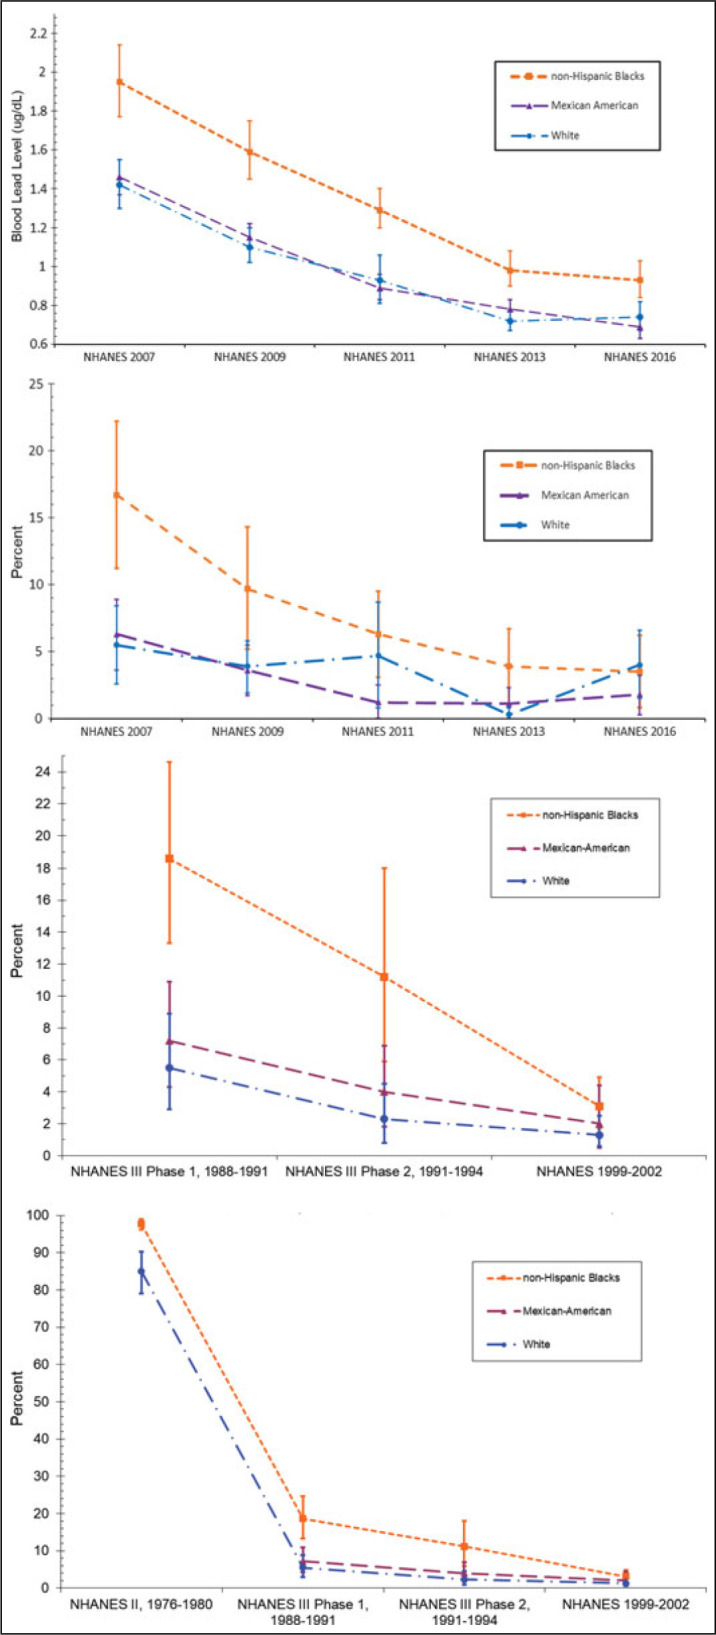
(A) Geometric Mean Blood Lead Levels in Children Aged 1 Through 5 Years, With 95% Confidence Intervals, US NHANES 2007-2016; (B) Percentage of Children Aged 1 Through 5 Years With Blood Lead Levels of 3.5 μg/dL and Greater, With 95% Confidence Intervals, US NHANES 2007-2016; (C) Percentage of US Children Aged 1 Through 5 Years With Blood Lead Levels of 10 μg/dL and Greater, With 95% Confidence Intervals, US NHANES 1988-2002; and (D) Percentage of US Children Aged 1 Through 5 Years With Blood Lead Levels of 10 μg/dL and Greater, With 95% Confidence Intervals, US NHANES 1976-2002a Abbreviation: NHANES, National Health and Nutrition Examination Survey. aFrom NHANES data and David Jacobs. This figure is available in color online (www.JPHMP.com)