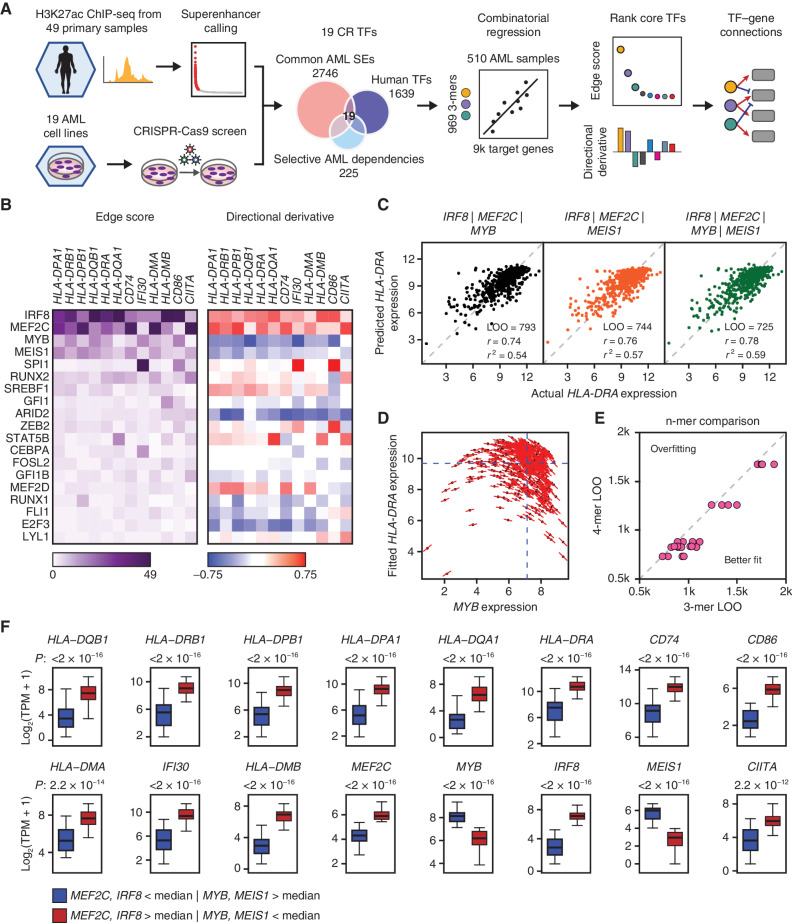
Figure 1.
CORENODE identifies a tetrad of TFs regulating MHCII genes in AML. A, Study schematic. B, Heat maps of edge scores (ES) and directional derivatives (DD) representing computationally established edges between target genes (columns) and TFs (rows, sorted by average ES). Higher ES corresponds to higher confidence edges, and DD predicts amplitude and directionality (positive vs. negative) of TF-target regulation. C, 3- and 4-mer CORENODE fits for the gene HLA-DRA with indicated goodness-of-fit metrics. D, A graphic illustration of DD. MYB expression is plotted against the CORENODE-fitted HLA-DRA expression using an IRF8/MEF2C/MYB 3-mer. Red sticks indicate MYB slopes aggregated from the 4 MYB-containing terms (linear, quadratic, and two cross-terms) in each sample. Aggregation of all MYB slopes for all samples produces MYB DD. E, Leave-one-out (LOO) error improvement between 3-mers [4 per gene (4 combinations of 4 TFs taken 3 at a time)] and the 4-mer (1 per gene, combining all 4 TFs) for 6 MHCII genes. F, Gene expression in two populations of the Beat AML data set. The blue population (n = 46) represents patient samples with below-median expression of IRF8 and MEF2C and above-median expression of MYB and MEIS1, and the red population (n = 56) represents patient samples with the opposite pattern of TF expression. The elements of the box plots are as follows: center line, median; box limits, upper and lower quartiles; whiskers, 1.5× interquartile range.

