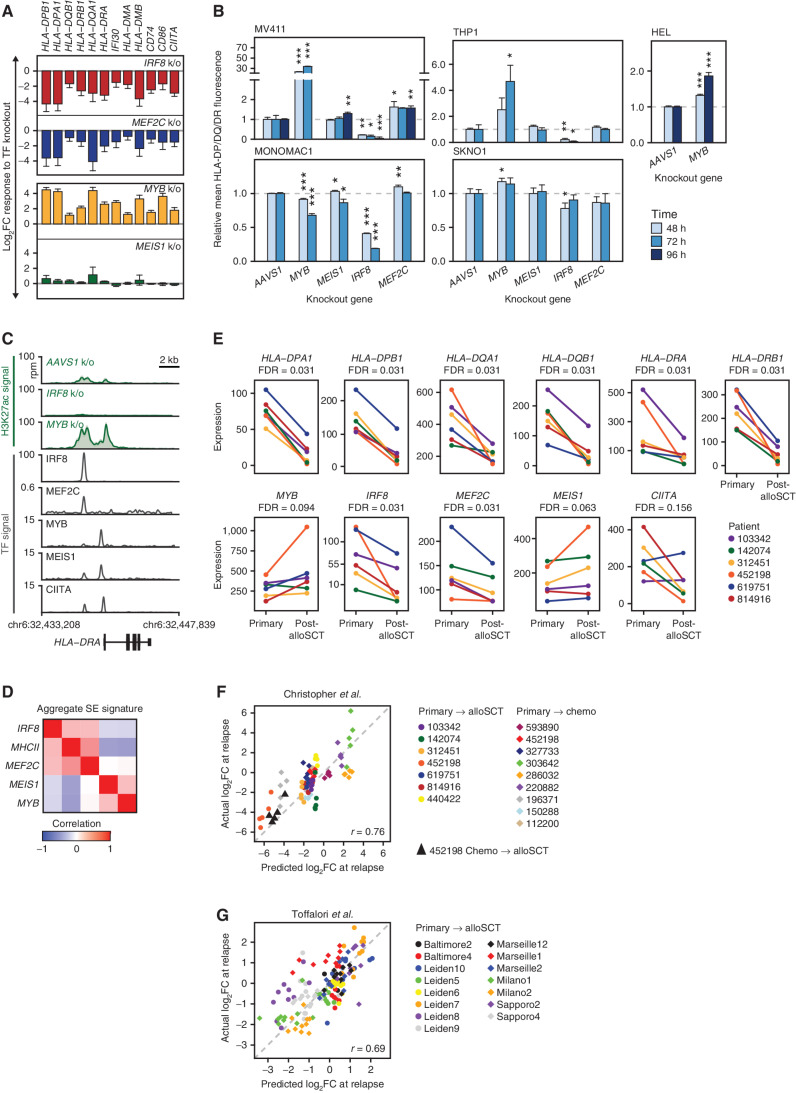
Figure 2.
IRF8, MEF2C, MYB, and MEIS1 regulate MHCII expression in AML. A, Transcriptional response of the indicated genes measured by mRNA-seq 72 hours after TF knockout. The experiment was performed in biological triplicates. Error bars represent standard error. MEF2C knockout changes were not significant after genome-wide adjustment for multiple hypothesis testing. Among MEIS1 knockout–induced changes only HLA-DRA and HLA-DQB1 had q-values <0.1. All shown MYB and IRF8 knockout–induced changes had q-values of <0.05. B, Changes in the surface expression of the MHCII molecules detected by immunostaining with a pan-specific anti–HLA-DP/DQ/DR antibody following TF knockout. An AAVS1 (“safe harbor”) targeting sgRNA was used as a control. The bar plots represent average values obtained from 3 replicates normalized to the AAVS1 control. Asterisks indicate P values calculated by a two-tailed t test comparing MHCII fluorescence between gene knockout and the AAVS1 control at the same time point. *, P ≤ 0.05; **, P ≤ 0.01; ***, P ≤ 0.001. C, H3K27 acetylation and TF binding in the HLA-DRA locus. Green tracks are H3K27ac metatracks composed of overlaying semitransparent area plots representing two biological replicates of the indicated TF knockouts compared with AAVS1 control. The average profile is represented by a thick line. Gray tracks represent the binding of the indicated TFs. All of the shown ChIP-seq experiments were performed in MV411 except for CIITA, which was downloaded from ref. (38) and represents a lymphoid cell line. Refer to Supplementary Fig. S4 for a map of H3K27 acetylation and TF binding in the entire MHCII locus and genome-wide analysis of H3K27ac changes. D, Similarity matrix of SE scores associated with the TF tetrad and MHCII genes using data from ref. (9) E, mRNA expression in six paired primary and post-alloSCT samples from ref. (3). F and G, CORENODE accurately predicts MHCII expression changes at relapse. The plots depict predicted by CORENODE vs. observed log2 fold change in MHCII expression in paired samples from ref. (3). F, and ref. (4). G, between initial presentation and relapse. For each patient (color-coded as indicated) each data point reflects predicted and observed changes in the expression of one MHCII gene. The IRF8/MYB/MEIS1/MEF2C 4-mer was used in F, and CIITA was added as a fifth term in G resulting in a better fit.

