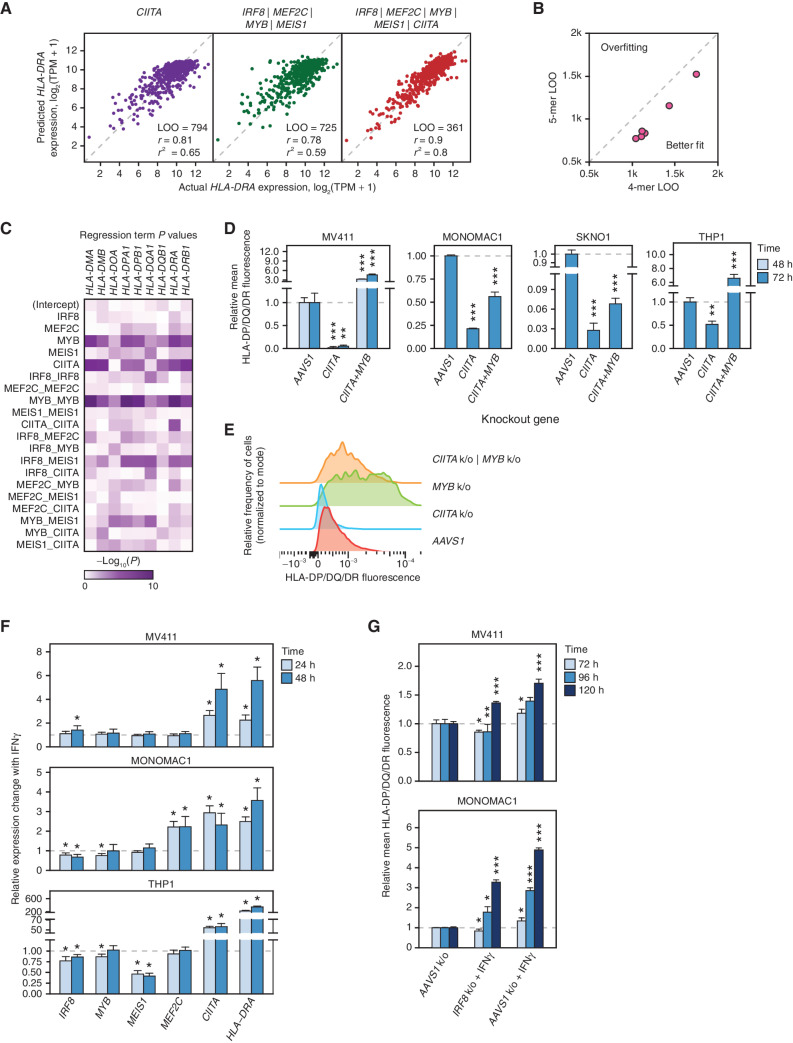
Figure 3.
CIITA-dependent and -independent regulation of MHCII genes by the TF tetrad. A, 1-mer CORENODE fit using CIITA (linear + quadratic term) as the only predictor of HLA-DRA expression, as well as 4- and 5-mer CORENODE HLA-DRA fits with indicated goodness-of-fit metrics. B, LOO improvement between TF 4-mers (6 fits, 1 per HLA gene) and 5-mers that include CIITA in addition to the 4 TFs. C, Heat map visualization of regression term P values representing the probability of the term's t-value being zero. Lower P values, visualized by denser color on the heat map, reflect a higher probability and magnitude of the term's independent contribution to the overall fit (see Supplementary Note for details). The statistics are calculated separately for each gene using the 5-mer composed of the TF tetrad and CIITA. D and E, Changes in the surface expression of HLA-DP/DQ/DR following CIITA ± MYB knockouts, detected by immunostaining with a pan-specific anti-HLA-DR/DP/DQ antibody. The bar plots (D) represent average fluorescence values obtained from 3 replicates with independent isotype controls and normalized to the AAVS1 control. Asterisks indicate P values calculated by a two-tailed t test comparing MHCII fluorescence between gene knockout and the AAVS1 control at the same time point. *, P ≤ 0.05; **, P ≤ 0.01; ***, P ≤ 0.001. The FACS histogram (E) represents one of 3 replicate experiments performed in MV411. F, Changes in the expression of the tetrad TFs, CIITA and HLA-DRA induced by treatment of MV411 cells with 10 ng/mL IFNγ, measured by TaqMan ΔΔCt RT-PCR normalized to HPRT1 as internal control, in four biological replicates. G, Induction of MHCII expression (measured as in D) by 10 ng/mL IFNγ in wild type (AAVS1 control) and IRF8 knockout MV411 cells.

