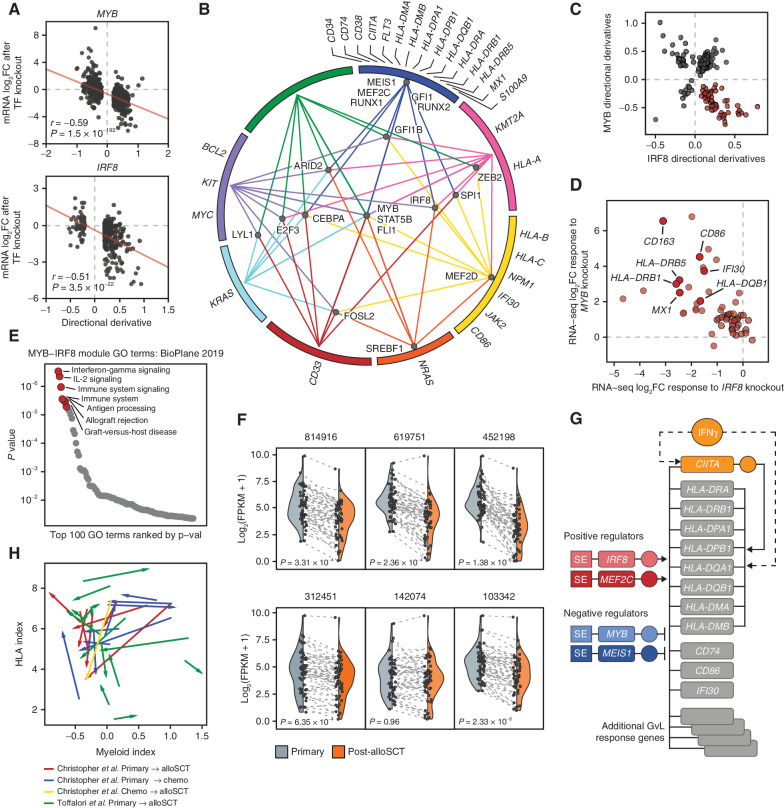
Figure 4.
Global transcription network decomposition by CORENODE. A, CORENODE validation by TF knockout followed by mRNA-seq. DD values (predicted response) for high-confidence MYB and IRF8 edges (ES ≥ 15 and [DD] ≥ 0.2) are plotted against actual log2 fold change in mRNA expression measured by RNA-seq 72 hours after MYB knockout (observed response). Spike-in control was used to account for the global transcriptional collapse after MYB knockout (refer to Supplementary Note for a detailed discussion). B, A graphic representation of the AML transcription regulation network reconstructed from the CORENODE output. The circle represents clusters of target genes coregulated by the TFs, as illustrated by TF-cluster edges. The proximity of the TFs to the clusters reflects their specificity toward them (for example, MYB regulates all clusters, whereas MEIS1 regulates only one cluster). A geometrically optimal map with the shortest aggregate distance of the TF-cluster edges was produced by solving for the unweighted Weber problem (see Supplementary Note). C, CORENODE identifies a gene module predicted to be repressed by MYB and activated by IRF8. Visualized are DD scores of all genes with high confidence (ES ≥ 15) MYB and/or IRF8 edges; 58 of these genes (highlighted in red) are predicted to be negatively regulated by MYB and positively regulated by IRF8. D, Transcriptional responses of the 58 genes comprising the GvL module depicted in C to MYB and IRF8 knockouts measured by RNA-seq are cross-plotted, confirming the predicted directionality of regulation for the vast majority of genes. Spike-in normalization was not used for this plot (see Supplementary Note). E, Gene set enrichment analysis of the MYB-IRF8 (GvL) module genes in C using Enrichr (43). F, Decreased expression of the GvL module in paired primary and post-alloSCT patient samples from ref. (3) with reduced MHCII expression at relapse. P values were calculated by a paired two-tailed t test. Each data point represents one gene with the dotted line linking expression values at presentation and after alloSCT. The shaded areas reflect probability density of the data smoothed by a kernel density estimator. G, Schematic of the proposed regulation of the MHCII and other GvL genes in AML by the TF tetrad. H, MHCII expression at relapse does not correlate with the myeloid differentiation state. The index of myeloid differentiation is plotted against combined MHCII expression in each paired sample and the direction of change between initial presentation and relapse is marked by arrows.

