Figure 5.
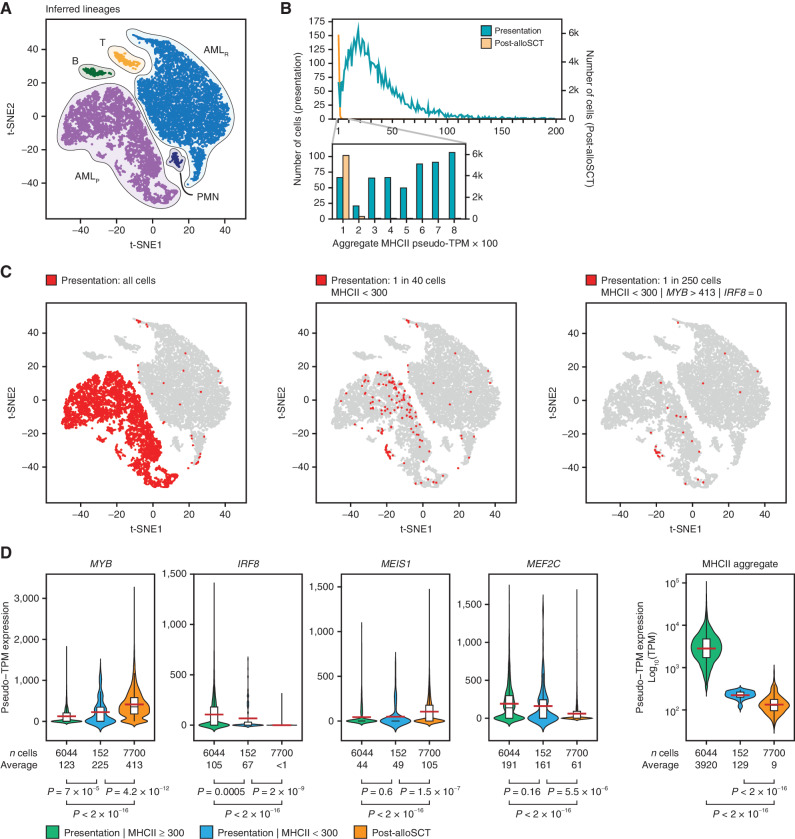
Single-cell RNA-seq reveals an adaptive mechanism of transcriptional evolution underlying relapse. A, scRNA-seq of AML cells obtained at initial presentation (AMLP) and post-alloSCT relapse (AMLR). Data from patient 452198 were downloaded from ref. (3) and clustered according to their genome-wide expression patterns using t-SNE. Cell lineages were inferred from the expression of lineage markers. B, Distribution of MHCII expression in AML cells. Individual cells are placed in bins according to their aggregate MHCII expression and cell frequency is plotted for each bin. C, t-SNE plots start with the same plot as in A but highlight cells from the initial presentation that fit the designated criteria. D, Single-cell expression of the TF tetrad in AML cells with low and high aggregate MHCII expression at presentation compared with relapse. P values were calculated by a two-tailed t test. The elements of the boxplots are as follows: black center line, median; red center line, mean; box limits, upper and lower quartiles; whiskers, 1.5× interquartile range. The shaded areas reflect the probability density of the data smoothed by a kernel density estimator.

