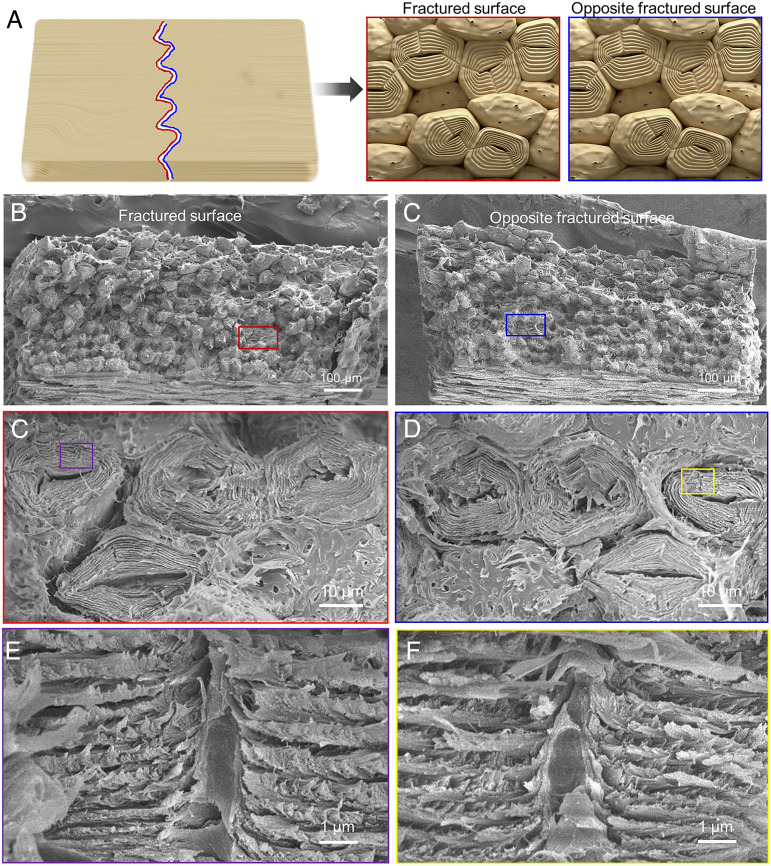
Fig. 6.
SEM images of the two fractured surfaces from one sample. Schematic illustration (A) and SEM images of the fractured surface (B) and the opposite fractured surface (C) from a sample. SEM images of pits guiding the fracture through the cells (C) and left broken cells behind on the opposite fracture surface (D). (E and F) Enlarged view of the pits in broken cells, which shows that the break of cellulose arrangement around the pit slows the crack.

