
Figure 3. Graphical representation of parallel mediation results.
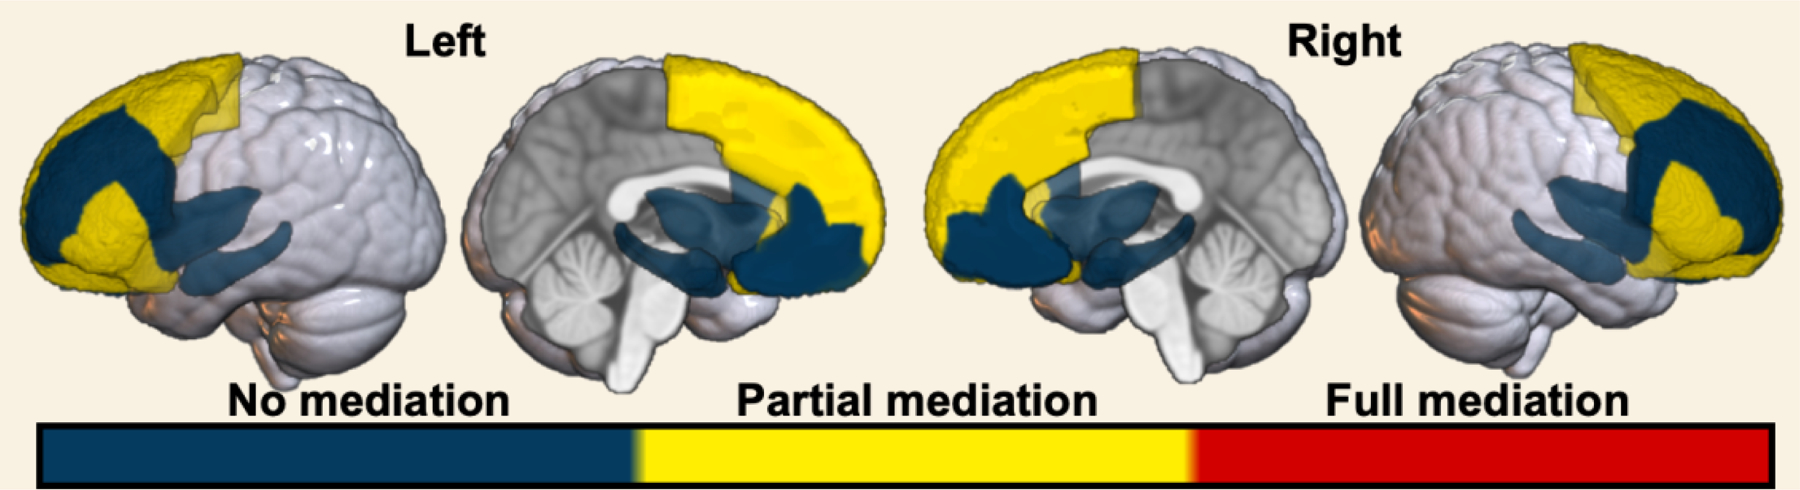
Parallel mediation modeling revealed no, partial, or full mediation of race-related differences on regional GMV by the adversity metrics. Blue – no significant total and/or indirect effect. Yellow – significant total, indirect, and direct effect. Red – significant total and indirect, but not direct, effect.