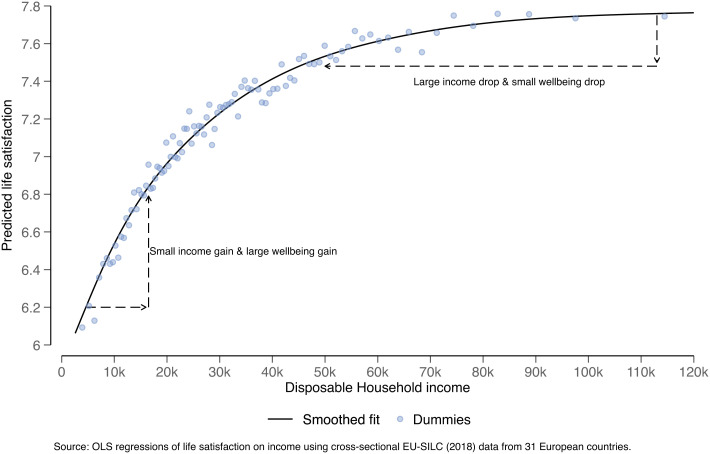
Fig. 1.
Illustration of the potential well-being gains from redistribution. This figure illustrates why redistribution can in principle raise well-being when the income-to-well-being relationship is curved in a concave way. The bottom left demonstrates that a relatively small income increase for low-income individuals can result in a large well-being gain. Contrastingly, as shown in the top right, a relatively large drop in incomes for high-income individuals will result in a relatively small well-being drop. The black line plots the result of an OLS regression of life satisfaction (measured on a 0–10 scale) on disposable household incomes. Incomes are here entered as a flexible spline. The dots show the result of a separate regression in which dummies are fitted for each percentile of the European income distribution. Both these regression equations control for age and age squared, gender, household size, number of children, education, employment status, migrant status, as well as country dummies. The data are cross-sectional, are representative of 31 European countries, and are sourced from the 2018 wave of the European Union Statistics on Income and Living Conditions survey (EU-SILC). Income is measured in Euros and after tax.

