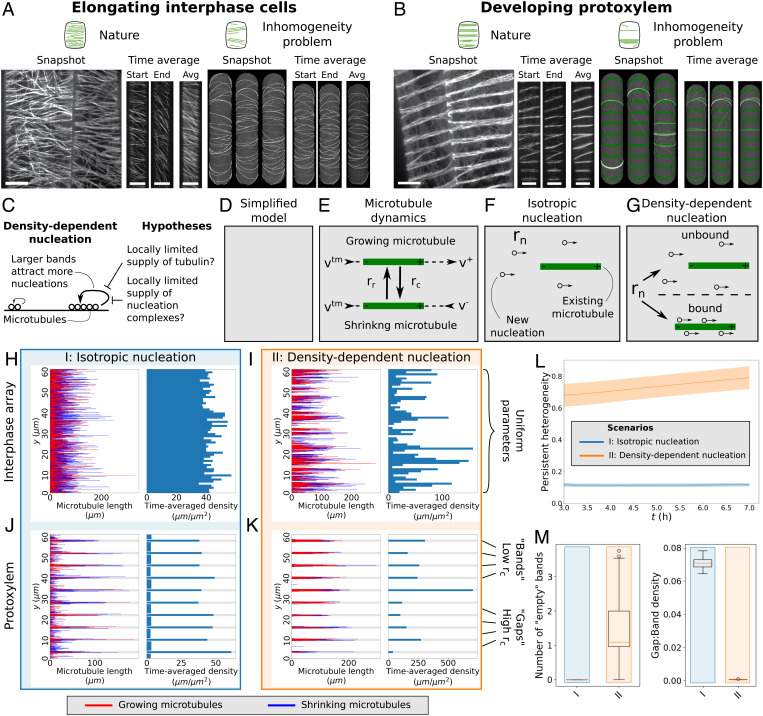
Fig. 1.
The inhomogeneity problem is reproduced by our simplified model. (A and B) Elongating interphase cells (A, Left) have homogeneous arrays of transversely oriented microtubules, while simulations with density-dependent nucleation (A, Right) yield highly inhomogeneous arrays. In developing protoxylem (B), microtubules are evenly distributed over a number of bands (B, Left), but in simulations with density-dependent nucleation, microtubules (white) accumulate in a small subset of the potential band positions, i.e., the green regions with favorable parameters for microtubule growth (B, Right). (Scale bars, 10 μm.) (C) Hypotheses for breaking the global competition caused by density-dependent nucleation. (D–G) Implementation of the simplified model with all microtubules perfectly transversely oriented (D). Under standard microtubule dynamics (E), microtubules grow or shrink at their plus ends with rates v+ and v−, respectively, retract at their minus ends with rate vtm, and undergo spontaneous catastrophes and rescues at rates rc and rr, respectively. Under isotropic nucleation (F), microtubules nucleate at a fixed rate rn at random (y-)positions. With density-dependent nucleation (G), nucleations still occur at a constant global rate rn, but a portion of these nucleations is now distributed across existing microtubules proportional to their length. (H–K) Microtubule lengths and positions and time-averaged microtubule density of representative simulations using the simplified model for interphase arrays (H and I) and developing protoxylem (J and K). Protoxylem simulations were run for 2 h without an increased catastrophe rate in gaps followed by 5 h with an increase of a factor three. Other simulations were run for 7 h. Time-averaging was done over the last 3 h. See SI Appendix, Movie S1–S4 for time-lapse videos of the corresponding simulations. (L) Measure of persistent heterogeneity over time for simulations of the interphase arrays of elongating cells. Lines and shaded areas indicate mean and standard deviation, respectively. (M) The number of empty bands (bands with less than 25% of average microtubule density in bands) and ratio of microtubule density between gaps and bands for the protoxylem simulations. Boxplots are based on quantities averaged over the last 2 h of the simulations. Quantities in (L) and (M) were calculated from 100 independent simulations per nucleation mode.

