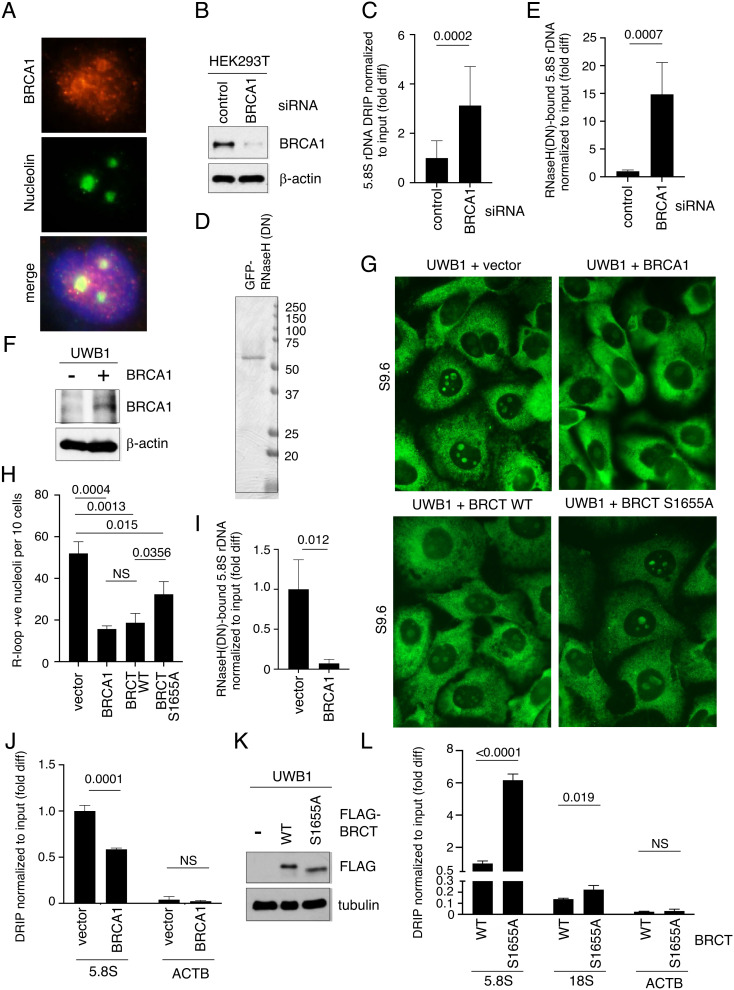
Fig. 1.
BRCA1 BRCT suppresses R-loops at rDNA. (A) Representative images showing immunofluorescent staining of BRCA1 (red, Top) and nucleolin (green, Middle) in U2OS cells. DAPI (blue) in the merged image (Bottom) was used to detect nuclei. (B) Western blot analysis of BRCA1 using an anti-BRCA1 antibody in whole cell extracts prepared from HEK293T cells transfected with control siRNA or BRCA1-specific siRNA. β-actin is used as a loading control. (C) DRIP analysis using S9.6 antibody to measure RNase H-sensitive, R-loop levels normalized to input DNA at 5.8S rDNA loci isolated from HEK293T cells transfected with control or BRCA1 siRNA. Y-axis represents fold difference (fold diff) relative to control siRNA. (D) Recombinant GFP-His6-RNaseH1 (DN) proteins purified from E. coli, separated by SDS-PAGE and stained with Coomassie blue. (E) Quantification of R-loops copurified with GFP-His6-RNaseH1 (DN) proteins normalized to input DNA at 5.8S rDNA loci in HEK293T cells transfected with control or BRCA siRNAs. Y-axis represents fold difference relative to control siRNA. (F) Western blot analysis of BRCA1 using an anti-BRCA1 antibody in whole cell extracts prepared from brca1-deficient UWB1 cells with or without exogenously expressed full-length BRCA1 proteins. β-actin is used as a loading control. (G) Representative images showing immunofluorescent staining of R-loops (green) using S9.6 antibody in UWB1 cells expressing indicated BRCA1, BRCA1 BRCT WT, or S1566A mutant fragment. Empty vector was used as transfection control. (H) Quantification of the number of nucleoli per ten cells showing positive nucleolar signals from samples shown in G. At least 150 cells were analyzed per sample. (I) Quantification of R-loops copurified with GFP-His6-RNaseH1 (DN) proteins normalized to input DNA at 5.8S rDNA loci in UWB1 cells with or without exogenously expressed BRCA1 protein. Y-axis represents fold difference relative to the UWB1 cells transfected with the vector alone. (J) DRIP analysis using S9.6 antibody to measure RNase H-sensitive, R-loop levels normalized to input DNA at 5.8S rDNA loci (Left) and ACTB EX3 (Right) isolated from UWB1 cells with or without exogenously expressed BRCA1. Y-axis represents fold difference relative to the 5.8S rDNA DRIP signal in the UWB1 cells transfected with the vector alone. (K) Western blot analysis of FLAG-BRCT using an anti-FLAG antibody in whole cell extracts prepared from brca1-deficient UWB1 cells with or without an exogenously expressed BRCA1 BRCT WT or S1655A fragment. Tubulin is used as a loading control. (L) RNase H-sensitive, R-loop levels measured by DRIP at 5.8S rDNA locus (Left), 18S rDNA locus (Middle), and ACTB EX3 region (Right) normalized to input DNA in UWB1 cells expressing WT or S1655A BRCT mutant fragment. Y-axis represents fold difference relative to the 5.8S rDNA DRIP signal in UWB1 cells transfected with WT BRCT.

