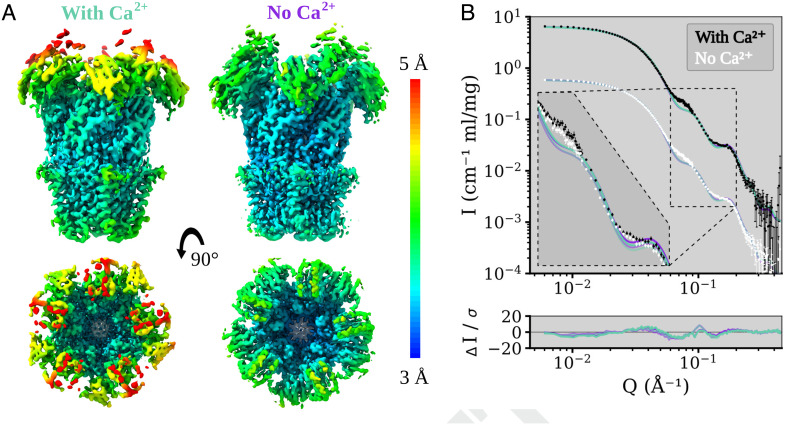
Fig. 2.
Local resolution coloring of the DeCLIC Cryo-EM reconstructions in the presence and absence of calcium and their agreement with the SANS data. (A) Cryo-EM densities of DeCLIC in the presence of 10 mM Ca2+ (Left), and from a Ca2+ chelated condition (Right). The densities were resolved to over all resolutions of 3.5 Å (condition with Ca2+) and 3.2 Å (condition with no Ca2+) respectively. Density is colored by local resolution according to the scale bar to the right. The quality is worse in the NTD region of the protein compared to that of the TMD or ECD. (B) Fits of model spectra calculated from the two cryo-EM structures in the presence (aquamarine) and absence (purple) of Ca2+ to SANS data collected with Ca2+ (black) and with no Ca2+ (white). The structures yield similar goodness of fit, χ2∈[11.2, 12.1]. SANS data with Ca2+ are offset by a factor of 10 for easier visualization. The inset shows the data on the same scale zoomed on Q ∈ [0.06, 0.2] Å−1, with darker curves fitted to the with-calcium SANS data and paler curves fitted to the calcium-free SANS data.

