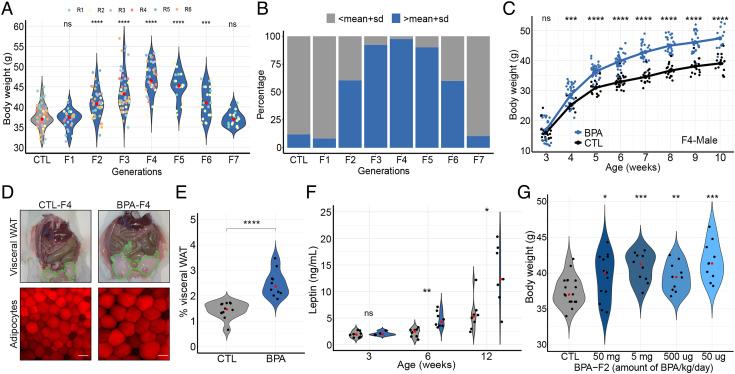
Fig. 1.
Analysis of BPA-induced obesity. (A) Changes in body weight between control and different generations of the male progeny of BPA-exposed P0 pregnant female mice at 10 wk of age. Results represent a combination of six different independent experiments in which 12 different females were exposed to BPA and crossed following the outline shown in SI Appendix, Fig. S1B. Four of these experiments were stopped at the F4 generation whereas two were continued up to the F7 generation. The number of mice analyzed were CTL n = 57, F1 n = 28, F2 n = 43, F3 n = 55, F4 n = 41, F5 n = 20, F6 n = 25, and F7 n = 19. (B) Percentage of obese mice in the F1–F7 generation progeny of BPA-exposed P0 pregnant females. Obese is arbitrarily defined as having a weight higher than the mean weight of control mice plus one SD. (C) Changes in body weight with age of males from control and the F4 generation progeny of BPA-exposed females (CTL n = 17, BPA n = 26). (D) Differences in visceral fat and adipocyte size in BPA-F4 versus control males; bar represents 50 μm. (E) Fraction of visceral adipose white tissue with respect to body weight in males from control and BPA-F4 (CTL n = 12, BPA n = 10). (F) Circulating leptin levels in serum of male mice of different ages from control and BPA-F4 (3 wk old; CTL n = 7, BPA n = 4, 6 wk old; CTL n = 8, BPA n = 8, 12 wk old; CTL n = 8, BPA n = 7). (G) Effect of different concentrations of BPA on the body weight of males from BPA-F2 (CTL n = 18, 50 mg n = 13, 5 mg n = 10, 500 μg n = 10, 50 μg n = 10). P values were calculated as indicated in the Statistical Analyses of Metabolic Data section of Methods; ****P < 0.0001, ***P < 0.001, **P < 0.01, *P < 0.05, ns not significant (SI Appendix, Fig. S1).

