Fig. 2.
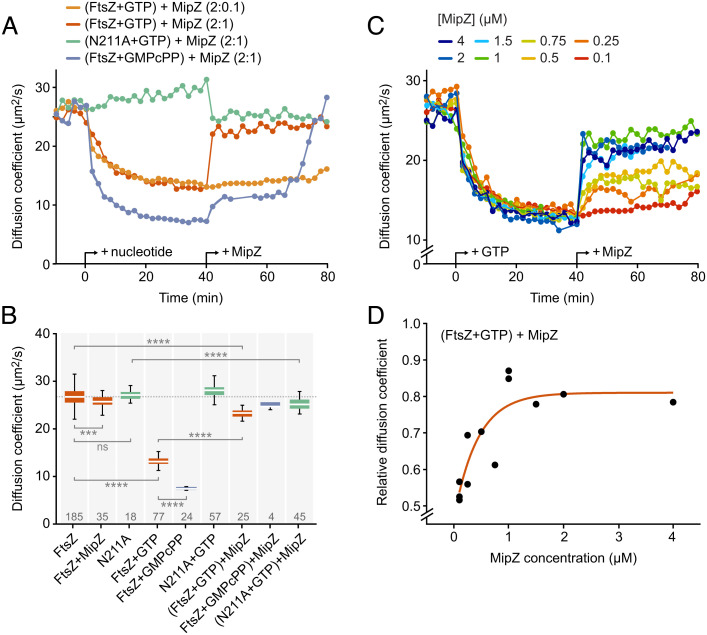
Effect of MipZ on the dynamics of FtsZ. (A) Time evolution of the diffusion coefficient of FtsZ measured by FCS. FtsZ or its monomeric variant FtsZN211A (2 µM), each containing 10% AlexaFluor488-labeled protein, was analyzed at 2 min intervals prior to and after the addition of the indicated nucleotide (2 mM for GTP, 0.2 mM for GMPcPP) and MipZ•ATPγS (at the indicated ratios), generated by preincubation of MipZ with 1 mM ATPγS. Data represent the average of 2 to 3 experiments. See SI Appendix, Fig. S3B for individual measurements. (B) Diffusion coefficients of FtsZ or FtsZN211A (2 µM) after the addition of MipZ•ATPγS (1 µM) in different conditions. The data shown represent averages of 2 to 3 consecutive FCS measurements made after signal stabilization. They are represented as box plots, with the white horizontal line indicating the median, the box the interquartile range, and the whiskers extending to the lowest and highest values within 1.5 times the interquartile range from the hinges. The number of data points obtained per condition is indicated at the bottom. The significance of differences to the respective MipZ-free condition was tested using the Student’s t test (ns: not significant, ***P < 0.001, ***P < 0.0001). (C) Time evolution of the diffusion coefficient of FtsZ after the addition of different concentrations of MipZ•ATPγS. FtsZ (2 µM) was analyzed at 2 min intervals prior and after the addition of GTP (2 mM) and, later, MipZ•ATPγS (at the indicated ratios). Data represent the (averaged) results of one to three experiments. (D) Change in the steady-state diffusion coefficient of FtsZ measured in the presence of GTP and MipZ•ATPγS relative to the diffusion coefficient of FtsZ-GDP alone as a function of the MipZ concentration. The values shown represent the average of consecutive measurements, obtained as described in (B). The data were fitted to the equation D(FtsZ + GTP + MipZ)/D(FtsZ − GTP − MipZ) = −0.34 * exp([MipZ]/−0.43) + 0.81.

