
Fig. 2.
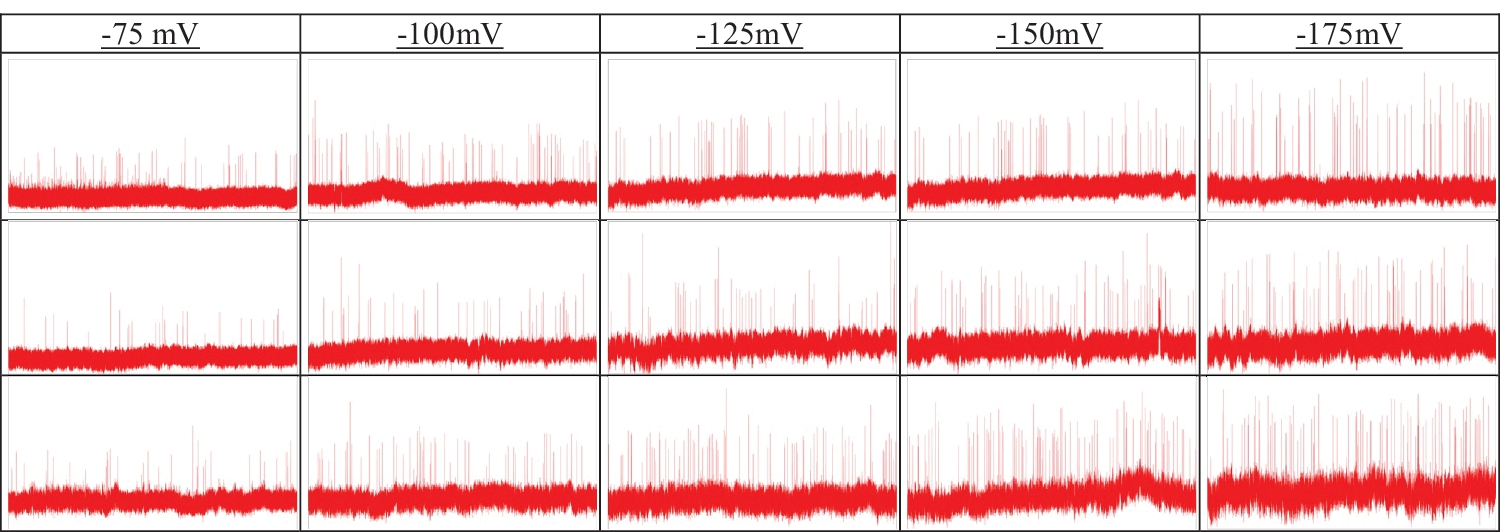
Representative current traces corresponding to the translocation of AAVs: AAVEmpty (top row), AAVssDNA (middle row), and AAVdsDNA (bottom row) for the different applied electric fields. The width and height of each image represent 10 sec and 2000 pA, respectively where pA stands for picoampere.