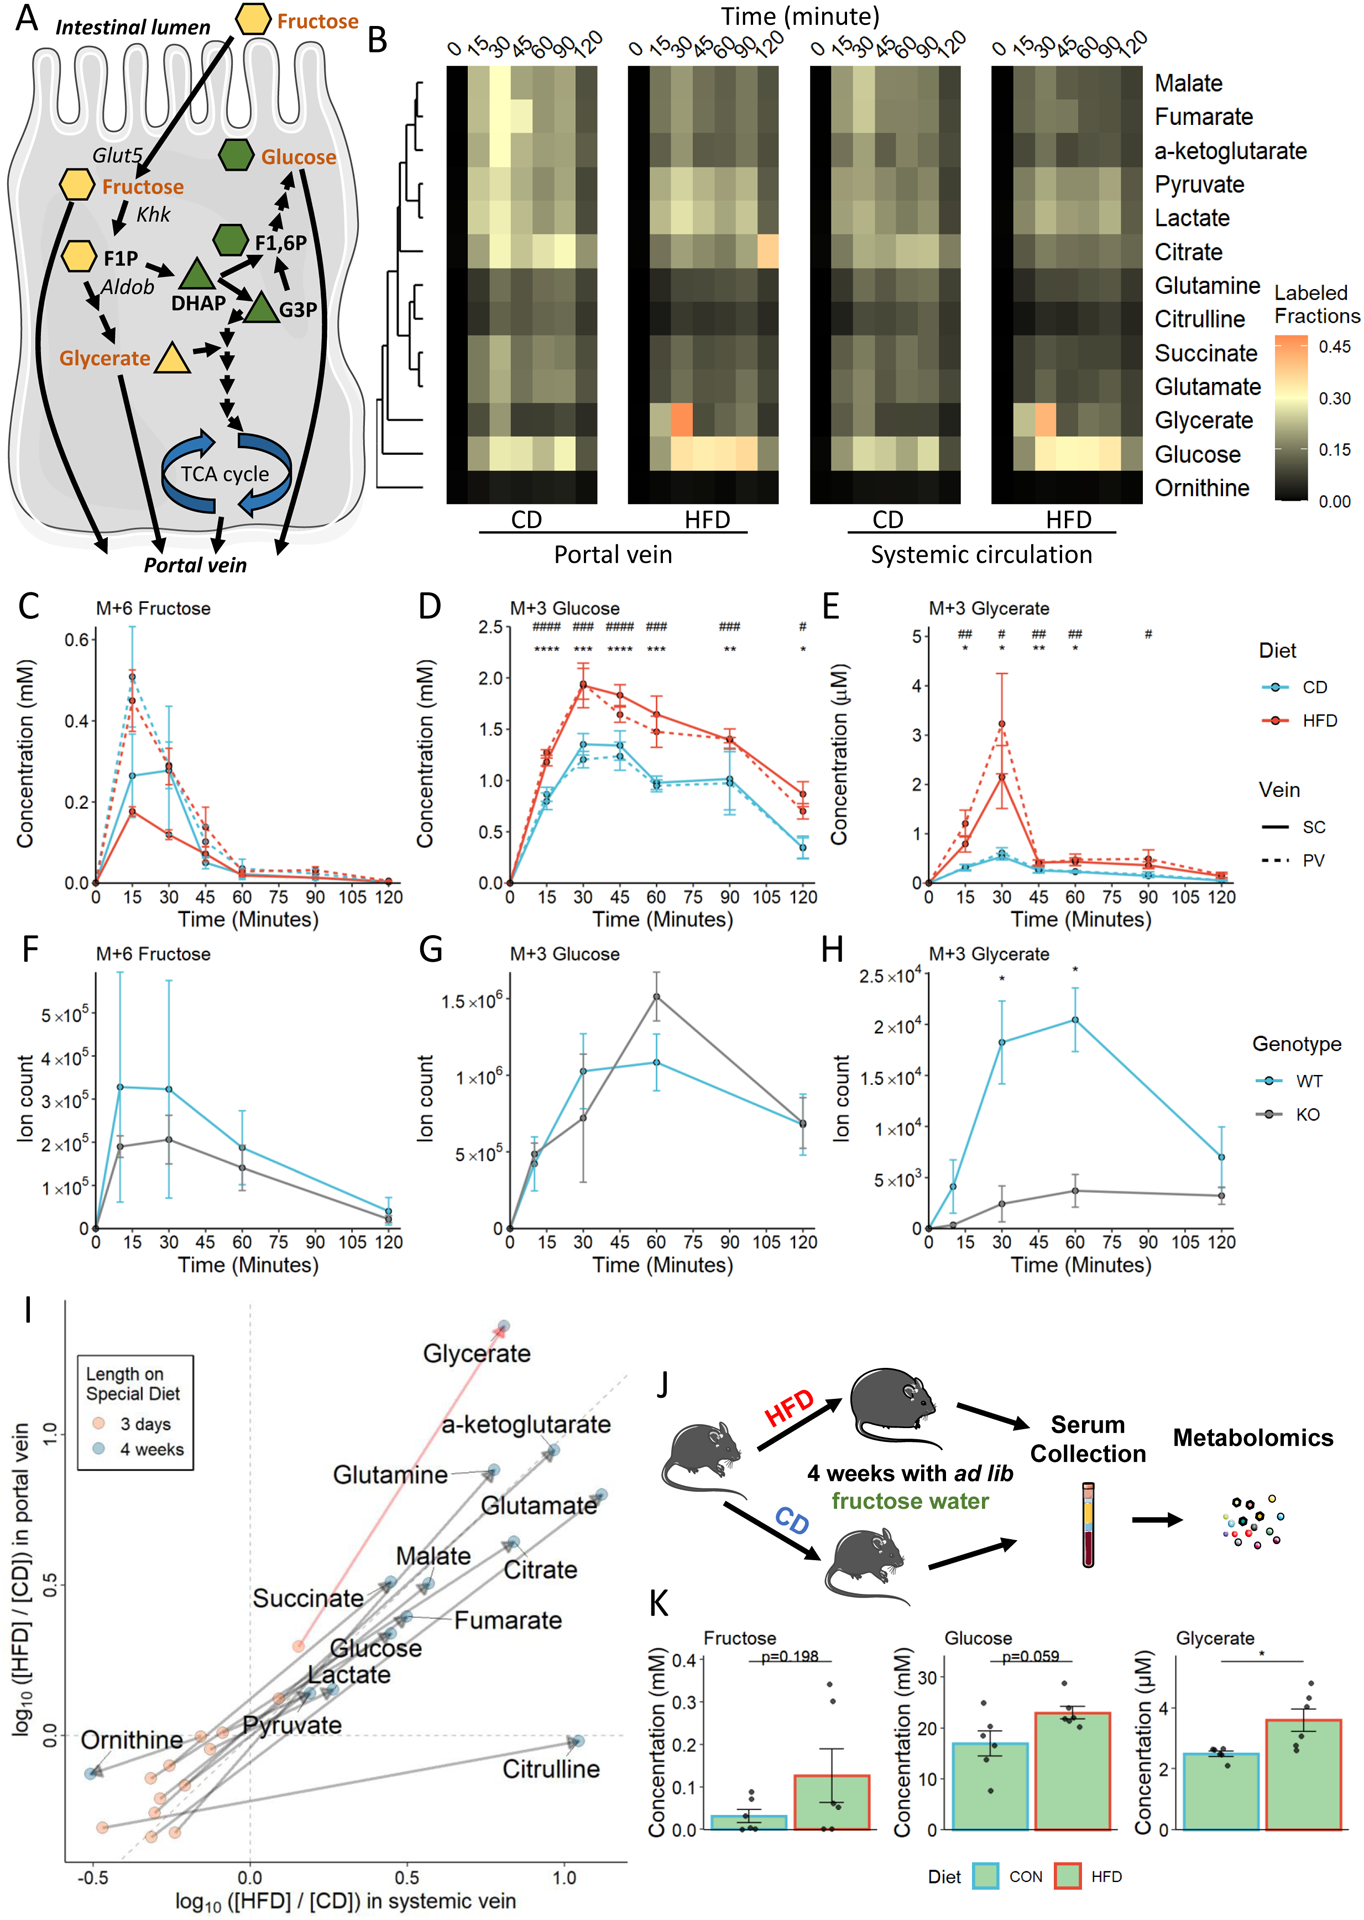
Figure 2. Serum metabolomic profile after U13C-fructose oral gavage.

A. Fructose metabolism overview. The shape of each metabolite depicting the number of carbons in the backbone.
B. Heatmap showing circulating labeled (M ≥ +1) metabolite fractions.
C - E. Absolute quantification of 13C -labeled metabolites in each of the circulation pools. *: p < 0.05, **: p < 0.01, ***: p < 0.001, ****: p < 0.0001 between HFD and CD groups in PV serum; #: p < 0.05, ##: p < 0.01, ###: p < 0.001, ####: p < 0.0001 between HFD and CD groups in SC serum.
F - H. Quantification of C13-labeled metabolites in SC serum in wild-type (WT) and intestine-specific Khk-c knockout (KO) mice.
I. Log fold change of the labeled (M ≥ +1) metabolites in the portal vein and systemic vein after 3-day or 4-week HFD feeding; serums were harvested 10 minutes after the fructose gavage. J. Experimental design of ad lib fructose drinking water experiment.
K. Absolute quantification of fructose-derived metabolites in systemic circulation.
N = 3 – 6 mice. Data are represented as mean ± SEM. T-test was used.*: p < 0.05, **: p < 0.01, ***: p < 0.001, ****: p < 0.0001. See also Figure S2.
