
Figure 4. The effect of fructose-derived glycerate on pancreatic islet cells.
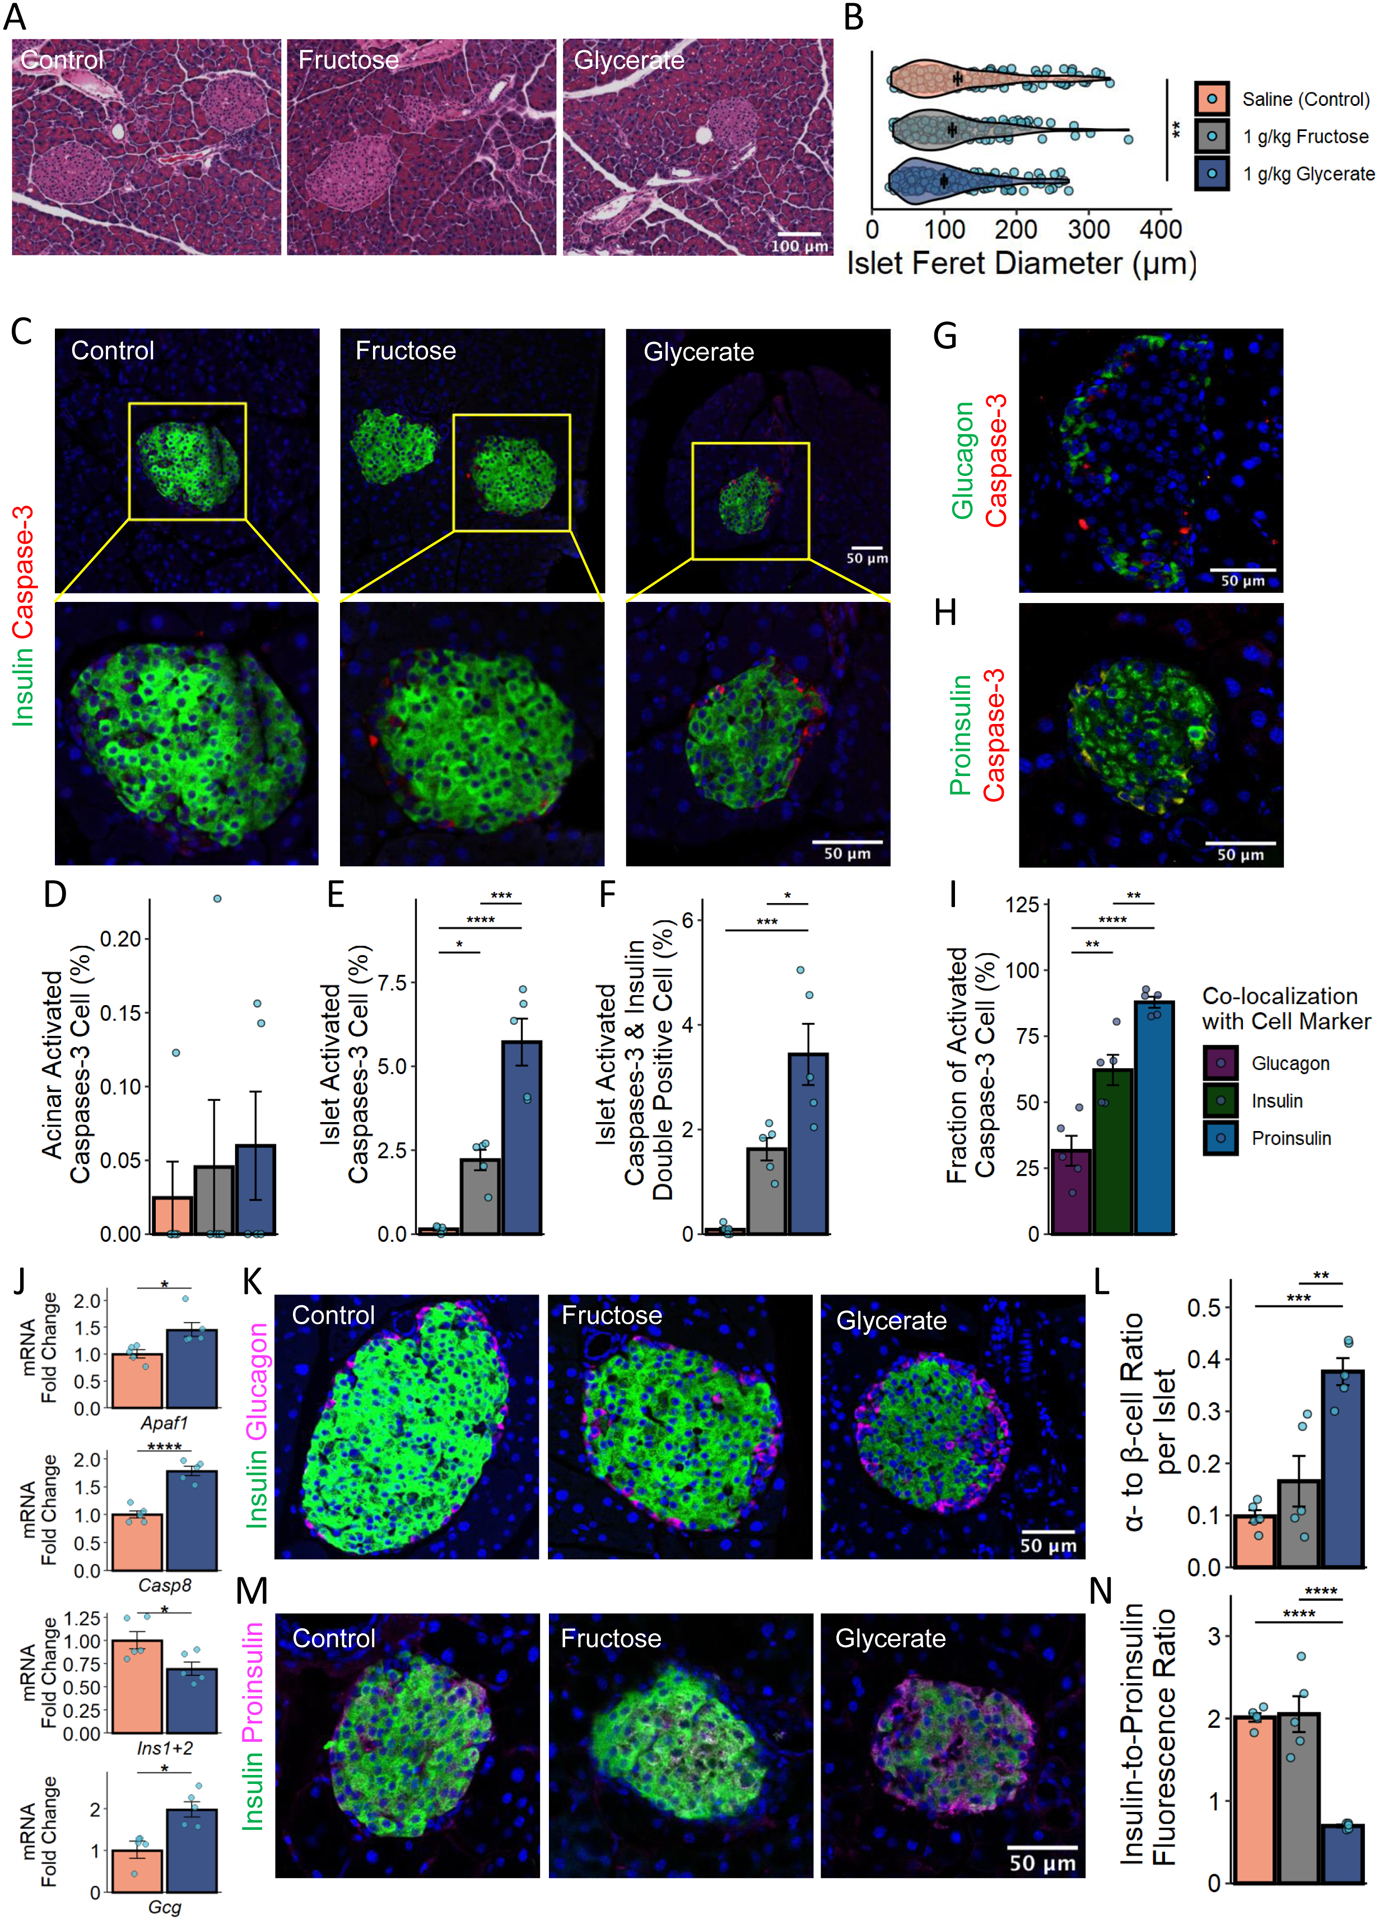
A & B. H&E staining of pancreas and quantification after 12 weeks of control (197 islets), fructose (159 islets), or glycerate (213 islets) treatment of mice fed on CD.
C - F. Insulin (green) and activated Caspase-3 (red) staining and the quantification of active Caspase-3 positive cells within the islet and other pancreatic regions.
G. Glucagon (green) and activated Caspase-3 (red) staining of the pancreas among mice receiving glycerate treatment.
H. Proinsulin (gree) and activated Caspase-3 (red) staining of the pancreas among mice receiving glycerate treatment.
I. Quantification of the proportion of activated caspase-3 positive cells that were also co-expressing the indicated pancreatic islet cell marker.
J. mRNA expression in isolated mouse islets after 12 weeks of treatment.
K & L. Insulin-Glucagon staining and the quantification of the α-cell to β-cell ratio.
M & N. Insulin-Proinsulin staining and the quantification of the insulin to proinsulin ratio. N = 5 mice for C-N. Data are represented as mean ± SEM. T-test was used for comparison between 2 groups and the post-hoc Tukey correction was performed after ANOVA was used for comparison more than 2 groups.*: p < 0.05, **: p < 0.01, ***: p < 0.001, ****: p < 0.0001. See also Figure S4.