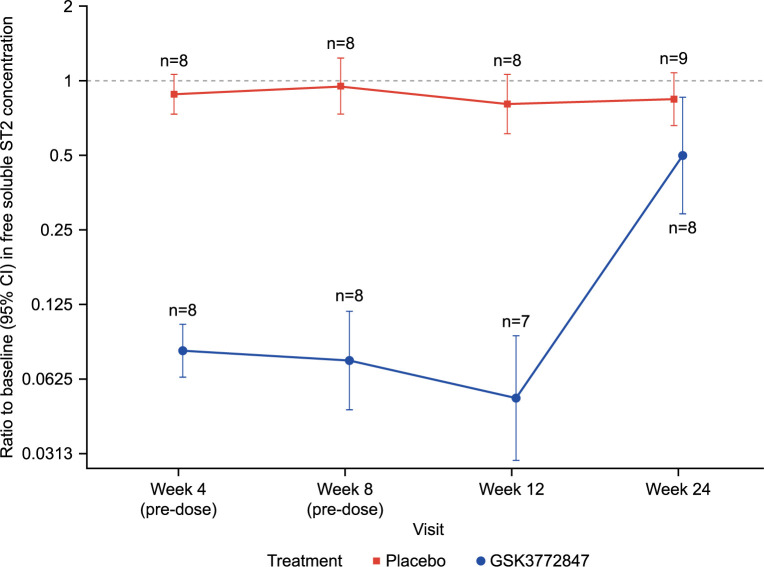
Fig 2. Ratio to baseline in free soluble ST2 levels*.
*This figure includes on- and off-treatment data (on-treatment defined window is 28 days). CI, confidence interval; ST2, suppressor of tumorigenicity 2. The raw data for this figure are provided as S1 Table.

