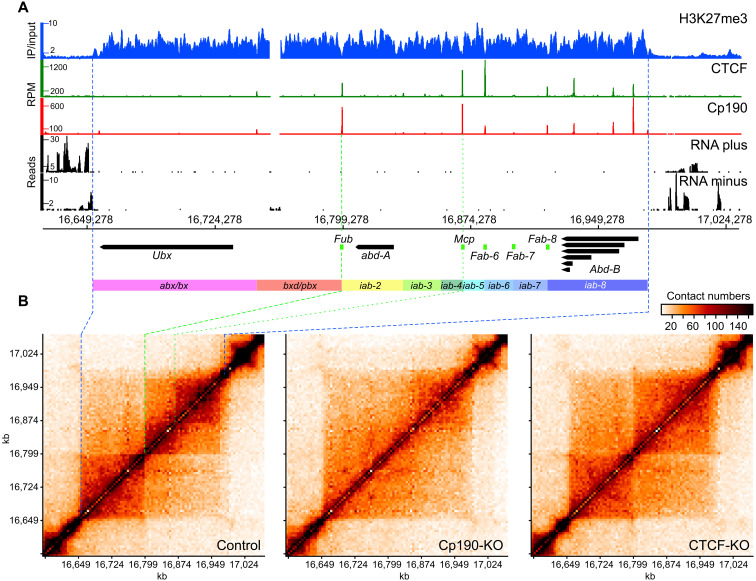
Fig. 2. Organization and chromatin topology of the bithorax complex.
(A) Genomic organization of the bithorax complex. ChIP-on-chip profiles of H3K27me3 in ML-DmBG3-c2 cells from (52) displayed as immunoprecipitation/input ratio, ChIP-seq profiles for Cp190 and CTCF in control cells [this study; displayed as the number of sequencing reads per position per million (RPM) of total reads], and RNA-seq profiles from control cells (displayed separately for each DNA strand as the number of sequencing reads per position) are shown above the coordinate scale (dm6, 2014 genome release). The positions of main alternative transcripts for Ubx, abd-A, and Abd-B genes are shown as thick arrows pointing in the direction of transcription. Note that transcripts flanking the bithorax complex genes are omitted for clarity. The positions of genetically defined insulator elements are indicated with green boxes. Regulatory domains are indicated as colored rectangles. (B) Chromatin contacts within the bithorax complex of the control, Cp190-KO, and CTCF-KO cells. The contacts measured by individual Hi-C experiments were assigned to 5-kb bins and normalized by IC (90). The data from replicate experiments were combined and plotted with gcMapExplorer software (80). The correspondence between the edges of the H3K27me3 domain in (A) and (B) is shown with blue dashed lines. The green dashed line indicates the position of the Fub insulator element, and the green dotted line shows the location of the Mcp insulator element.

