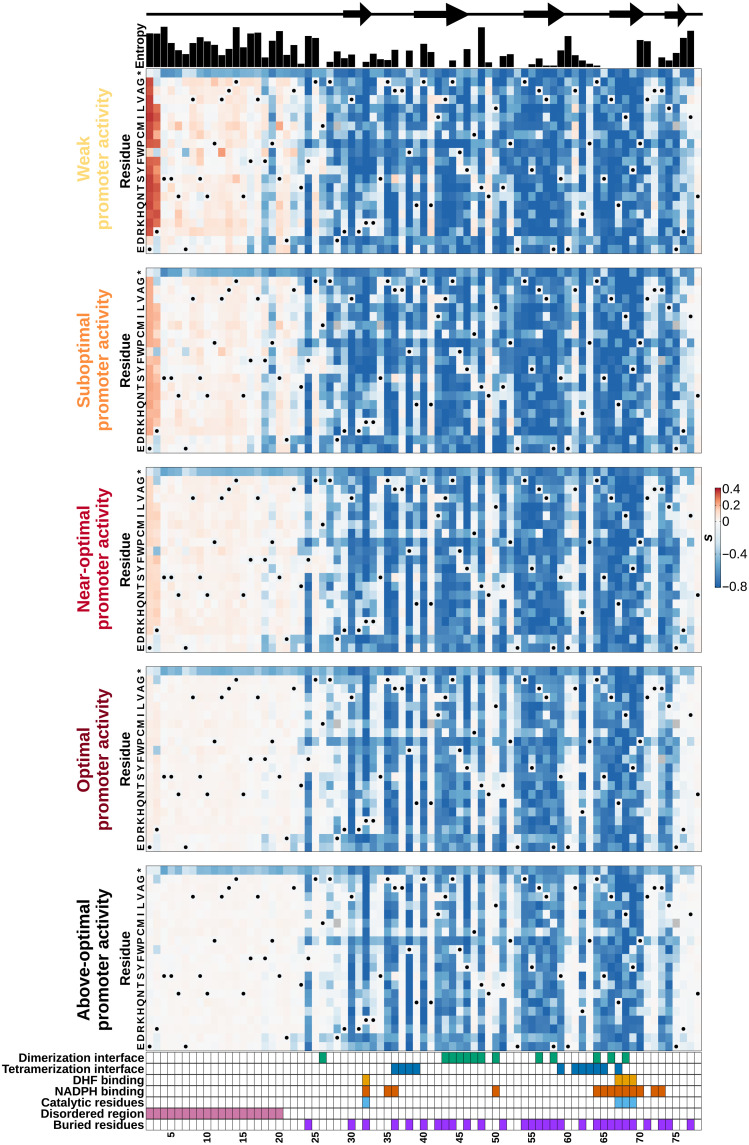
Fig. 3. The DfrB1 fitness landscape changes with promoter activity level in a very heterogeneous way along the protein sequence.
Selection coefficient (s) of individual amino acid substitutions (rows) at different positions (columns) at five promoter activity levels. Annotations above the first panel indicate the protein’s local secondary structure (arrows indicate β strands) and sequence diversity among homologs (Shannon entropy). The annotations at the bottom of the last panel highlight residues that participate in the interfaces of the DfrB1 homotetramer, which come into contact with either the substrate (DHF) or the cofactor [NADPH (reduced form of nicotinamide adenine dinucleotide phosphate)], key catalytic residues, the disordered region, and buried sites. Interfaces are labeled as dimerization and tetramerization interfaces following (20). Residues marked with a dot on the heatmaps are WT residues (WT codons and their synonymous ones).

