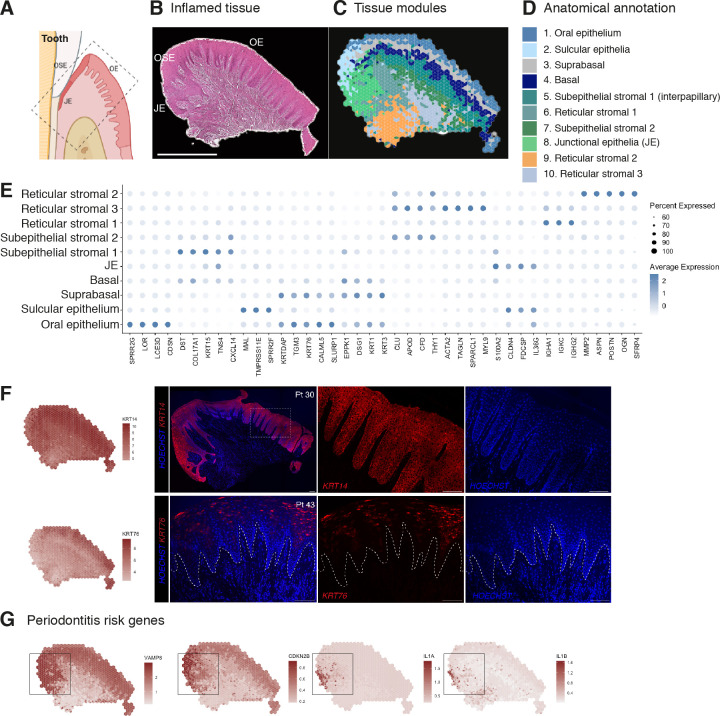
Figure 2. Human oral mucosa structure in oral chronic inflammatory disease.
(A) Schematic illustration of the human oral mucosa showing the different epithelial regions, oral epithelium (OE), oral sulcular epithelium (OSE), and junctional epithelium (JE). Created with Biorender. (B) H&E image of the representative inflamed oral mucosa section demonstrating demarcation between the distinct epithelia, and connective tissue region. (C) Human oral mucosa regions present in the assayed section using BayesSpace. (D) Anatomical annotation of unbiased transcriptional tissue regions. (E) Markers of tissue compartment differentially expressed genes used for tissue annotation showing percent of expressing cells (circle size) and average expression (colour) of gene markers (rows) across compartments (columns). (F) Immunofluorescence image validation stained for KRT14 and KRT76 (representative image, n = 3 samples). Scale bars: 100 µm. (G) Mapping of periodontitis risk genes showing VAMP8, CDKN2B, IL1A, and IL1B restricted expression in the junctional epithelium region.

