. 2023 Jan 17;12:e81525. doi: 10.7554/eLife.81525

Figure 5. Mapping of oral mucosa major cell types across conditions.

(A) Spatial expression of genes encoding for main human oral mucosa cell types. We selected the top differentially expressed genes for each cell type and predicted their expression at subspot resolution xgboost in BayesSpace. H&E staining shown here for clarity. (B) Spatial mapping of immune cell types showing overall increase in disease. (C) Neutrophils mapping using expression of CXCR2 and FCGR3B.

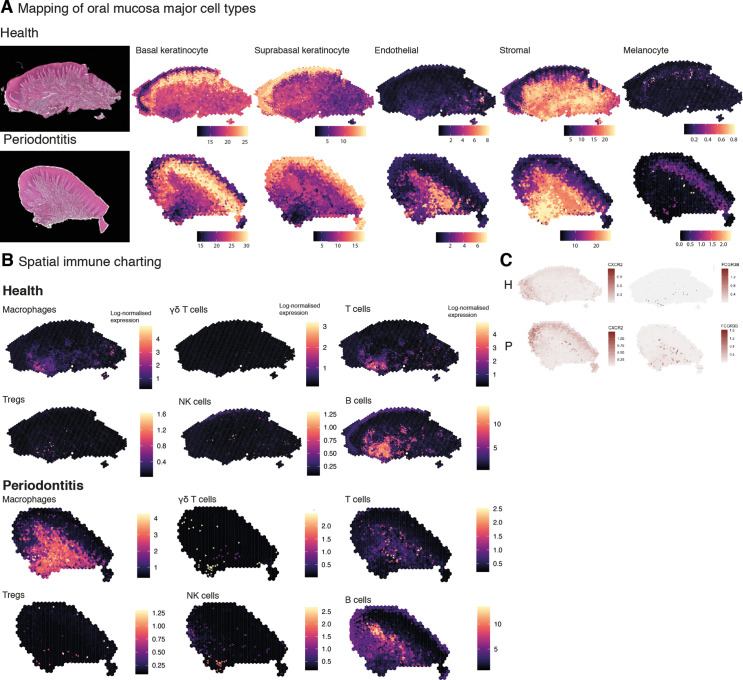
Figure 5.

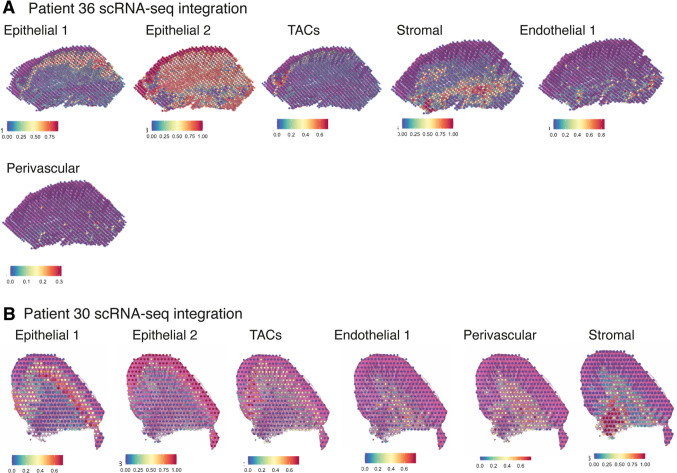
Figure 5—figure supplement 1. Validation of ST method by comparison of human oral mucosa tissue spots with histological landmarks and integration analyses with single-cell RNA sequencing cell type annotations.

Figure 5—figure supplement 1.

(A) Probabilistic classification for epithelial, stromal, endothelial, and perivascular scRNA-sequencing derived classes for patient 36 (health). (B) Probabilistic classification for epithelial, stromal, endothelial, and perivascular scRNA-sequencing derived classes for patient 30 (disease).
Figure 5—figure supplement 2. Cell type mapping for all biological/technical replicates used in ST analyses.

Figure 5—figure supplement 2.

Spatial expression of genes encoding for main human oral mucosa cell types. We selected the top differentially expressed genes for each cell type and predicted their expression at subspot resolution xgboost in BayesSpace.