. 2023 Jan 20;12:e81604. doi: 10.7554/eLife.81604

Figure 2. Polymicrobial context shifts tobramycin sensitivity of CF pathogens.

Colony forming units of planktonic (P) and biofilm (B) populations of (A) P. aeruginosa (Pa), (B) S. aureus (Sa), (C) S. sanguinis (Strep), and (D) P. melaninogenica (Prev) grown as monocultures or mixed communities (Mix) and challenged or not with 100 µg/mL of tobramycin (+Tb). Each data point presented in a column represents the average from at least three technical replicates performed at least on three different days (n=3). Statistical analysis was performed using ordinary one-way ANOVA and Tukey’s multiple comparisons posttest with *, p<0.05; **, p<0.01; ****, p<0.0001, ns = non-significant, and bd = below detection. Error bars represent SD.

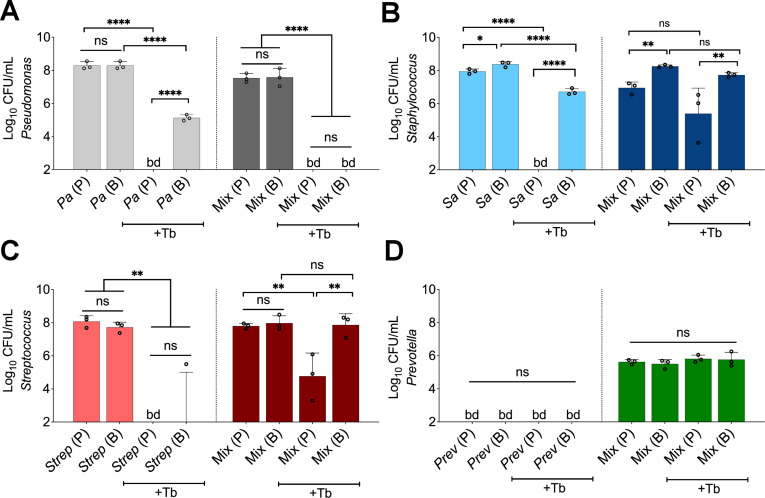
Figure 2.

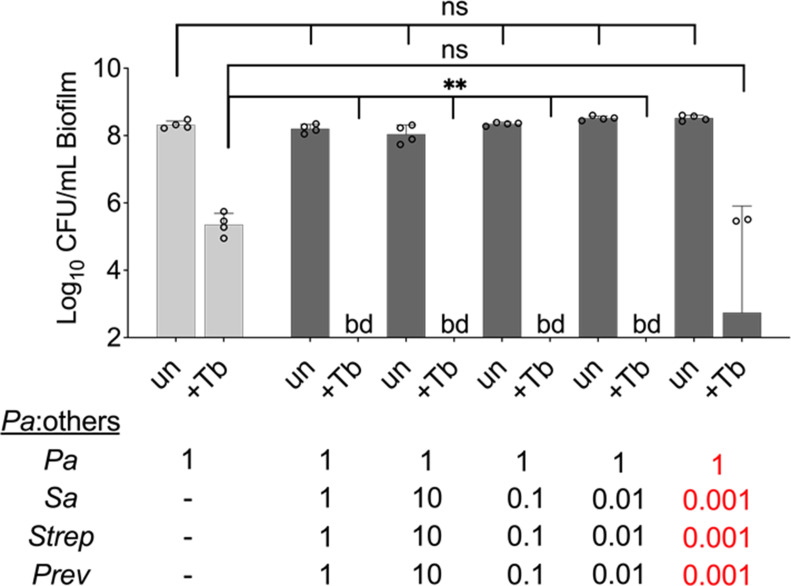
Figure 2—figure supplement 1. Microbial partners increase the killing of P. aeruginosa exposed to tobramycin in a mixed community over a wide range of population sizes.

Figure 2—figure supplement 1.

Colony forming units (CFUs) of P. aeruginosa grown in the presence of varying concentrations of S. aureus, S. sanguinis, and P. melaninogenica ranging from 10× the initial abundance of P. aeruginosa to 1000× less (0.001) for all three of the other organisms, and then treated with tobramycin. P. aeruginosa was inoculated at the same starting OD600 in all conditions. Each data point presented in a column represents the average from at least three technical replicates performed at least on three different days (n=4). Statistical analysis was performed using ordinary one-way ANOVA and Tukey’s multiple comparisons posttest with **, p<0.01. Error bars represent SD. ns = non-significant, bd = below detection, +Tb = +100 µg/mL tobramycin, un = untreated. Pa = P. aeruginosa, Sa = S. aureus, Strep = S. sanguinis, and Prev = P. melaninogenica. Monoculture biofilm = light gray and mixed biofilm = dark gray.
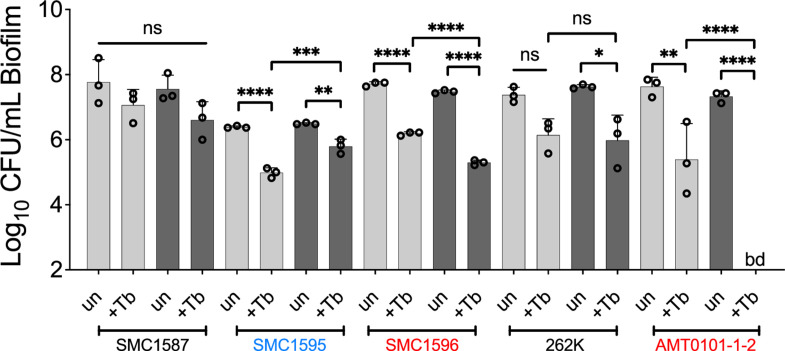
Figure 2—figure supplement 2. Drug sensitivity of P. aeruginosa clinical strains grown in a mixed community challenged with tobramycin.

Figure 2—figure supplement 2.

Colony forming units (CFUs) of various P. aeruginosa strains grown as monocultures (light gray) or mixed biofilm communities (dark gray) treated with tobramycin. Each data point presented in a column represents the average from at least three technical replicates performed at least on three different days (n=3). Statistical analysis was performed using ordinary one-way ANOVA and Tukey’s multiple comparisons posttest with *, p<0.05; **, p<0.01; ***, p<0.001, and ****, p<0.0001; ns = non-significant, bd = below detection, +Tb = +100 µg/mL tobramycin, and un = untreated. Error bars represent SD.
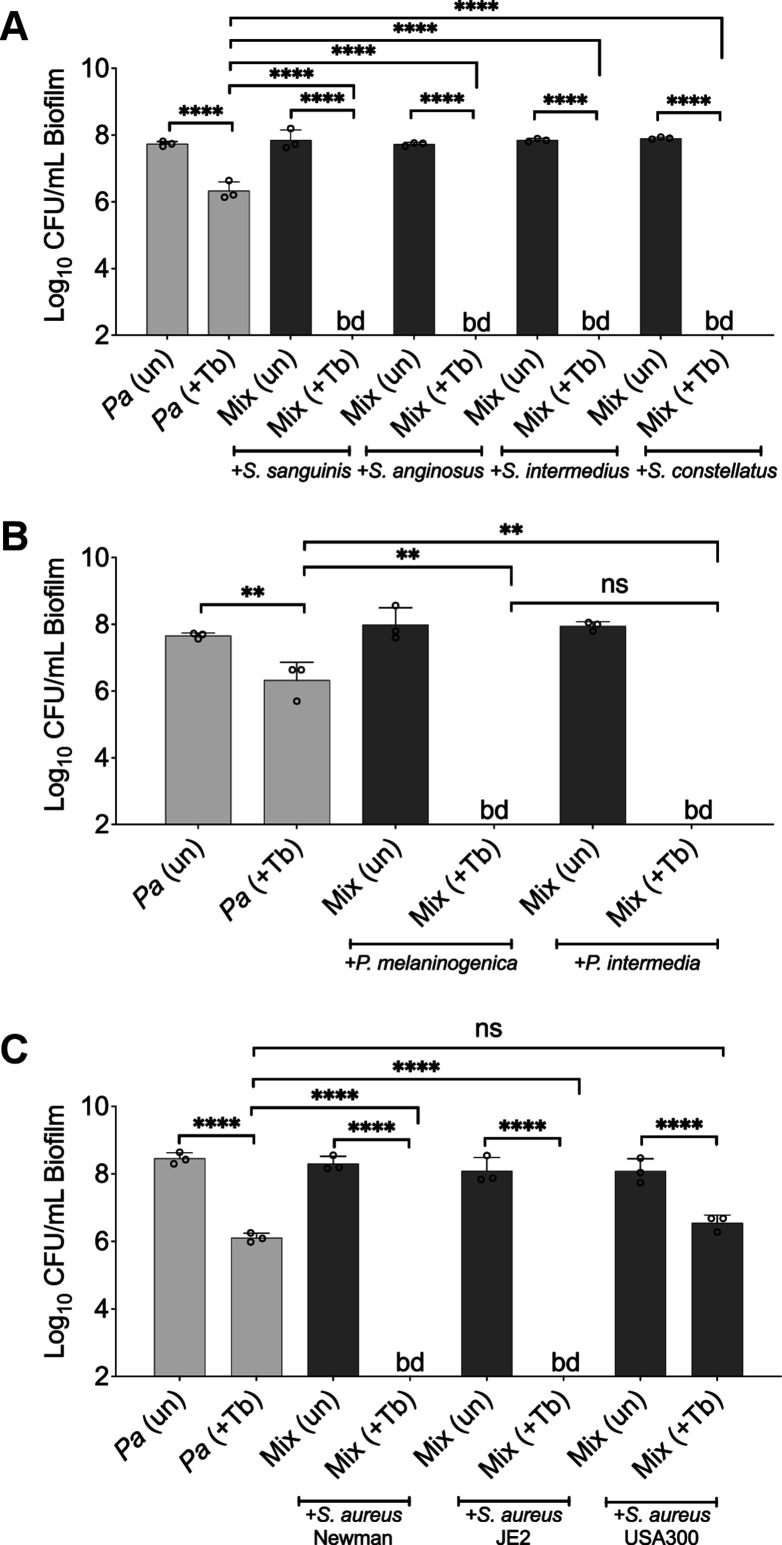
Figure 2—figure supplement 3. Shifted sensitivity of P. aeruginosa PA14 grown in a mixed community using various laboratory strains and clinical isolates treated with tobramycin.

Figure 2—figure supplement 3.

Colony forming units (CFUs) of P. aeruginosa PA14 biofilms grown as monocultures (light gray) or mixed communities (dark gray) in the presence of (A) S. sanguinis, Streptococcus anginosus, Streptococcus intermedius, and Streptococcus constellatus, (B) P. melaninogenica and Prevotella intermedia, or (C) S. aureus strains treated with tobramycin. Each data point presented in a column represents the average from at least three technical replicates performed at least on three different days (n=3). Statistical analysis was performed using ordinary one-way ANOVA and Tukey’s multiple comparisons posttest with **, p<0.01 and ****, p<0.0001, ns = non-significant. bd = below detection, Pa = P. aeruginosa, P. mel = P. melaninogenica, P. int = Prevotella intermedia, +Tb = +100 µg/mL tobramycin, and un = untreated. Error bars represent SD.
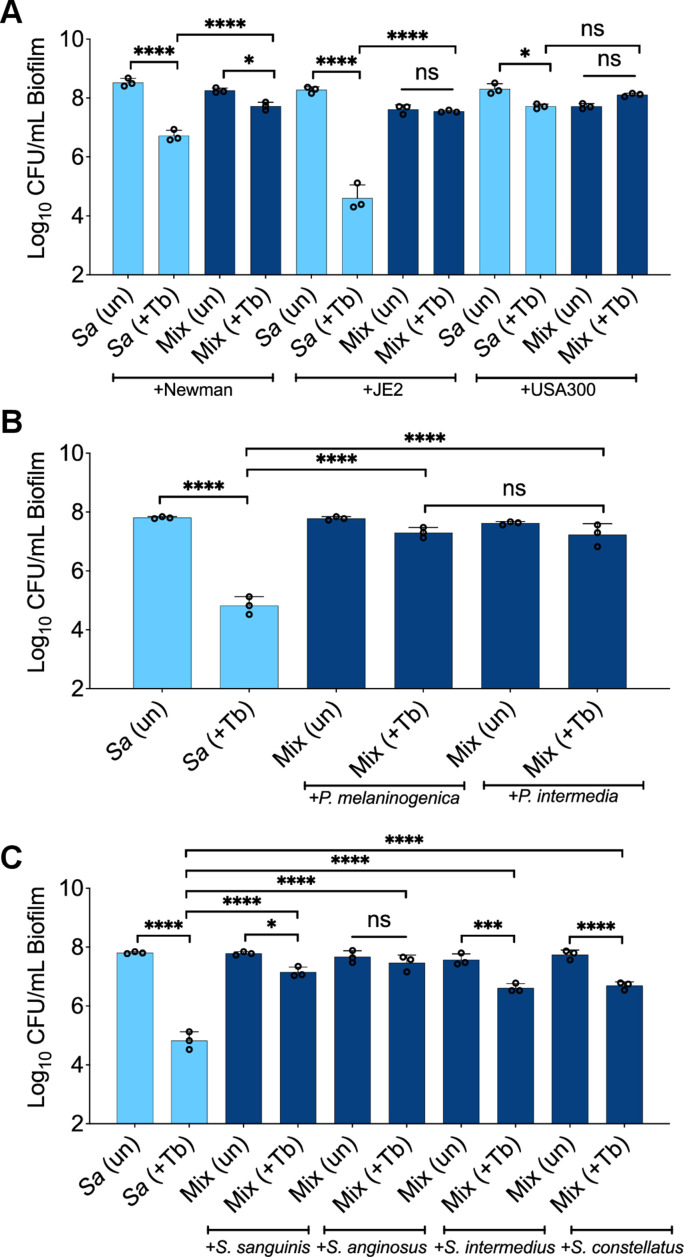
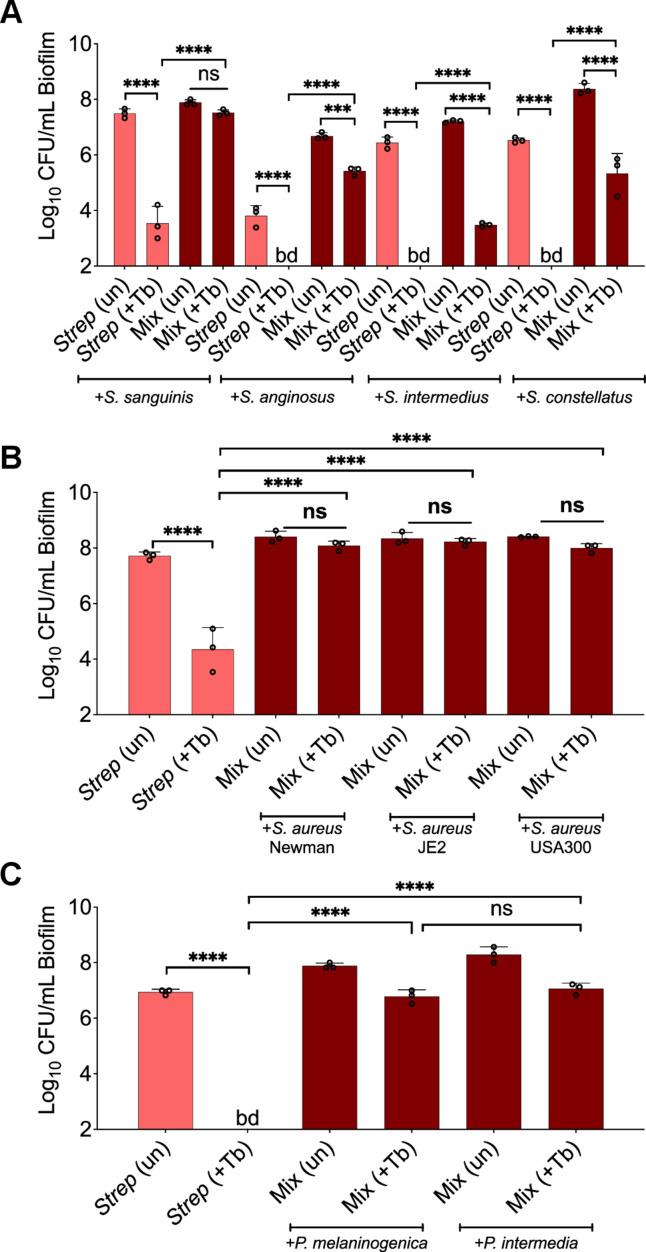
Figure 2—figure supplement 4. Recalcitrance of S. aureus biofilms grown in a mixed community composed of various strains and treated with tobramycin.

Figure 2—figure supplement 4.

S. aureus colony forming units (CFUs) when grown as monocultures (light blue) or mixed communities (dark blue) treated with tobramycin for (A) S. aureus strains spp., (B) Prevotella spp., and (C) Streptococcus spp. Each data point presented in a column represents the average from at least three technical replicates performed at least on three different days (n=3). Statistical analysis was performed using ordinary one-way ANOVA and Tukey’s multiple comparisons posttest with *, p<0.05; ***, p<0.001, and ****, p<0.0001; ns = non-significant, bd = below detection, +Tb = +100 µg/mL tobramycin, un = untreated, Sa = S. aureus Newman, P. inter = P. intermedia, and P. mel = P. melaninogenica. Error bars represent SD.
Figure 2—figure supplement 5. Recalcitrance of Streptococcus spp. biofilms grown in a mixed community composed of various strains and treated with tobramycin.

Figure 2—figure supplement 5.

Streptococcus spp. colony forming units (CFUs) when grown as monocultures (light red) or mixed communities (dark red) treated with tobramycin for (A) Streptococcus spp., (B) S. aureus strains, or (C) Prevotella spp. Each data point presented in a column represents the average from at least three technical replicates performed at least on three different days (n=3). Statistical analysis was performed using ordinary one-way ANOVA and Tukey’s multiple comparisons posttest with ***, p<0.001 and ****, p<0.0001, ns = non-significant, bd = below detection, +Tb = +100 µg/mL tobramycin, un = untreated, Strep = S. sanguinis, P. inter = P. intermedia, and P. mel = P. melaninogenica. Error bars represent SD.
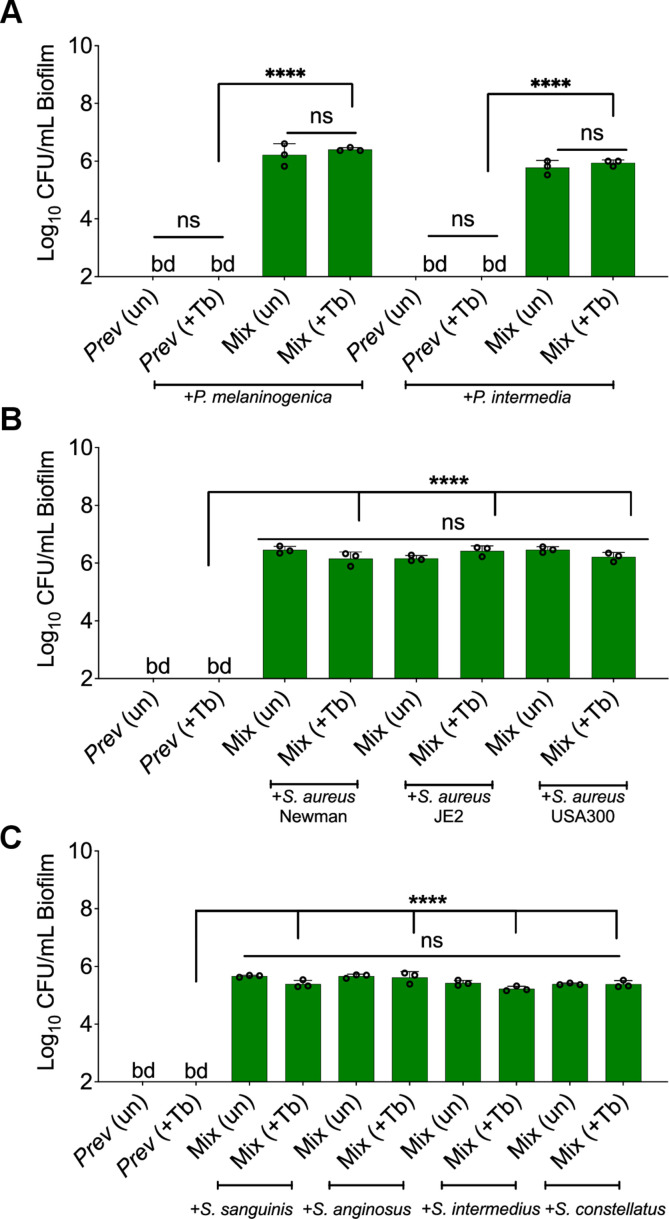
Figure 2—figure supplement 6. Recalcitrance of Prevotella spp. biofilms grown in a mixed community composed of various strains and treated with tobramycin.

Figure 2—figure supplement 6.

Prevotella spp. colony forming units (CFUs) when grown as monocultures (light green) or mixed communities (dark green) treated with tobramycin for (A) Prevotella spp., (B) S. aureus strains, or (C) Streptococcus spp. Each data point presented in a column represents the average from at least three technical replicates performed at least on three different days (n=3). Statistical analysis was performed using ordinary one-way ANOVA and Tukey’s multiple comparisons posttest with ****, p<0.0001, ns = non-significant, bd = below detection, +Tb = +100 µg/mL tobramycin, un = untreated. For Panel (A), Prev = P. intermedia, or P. melaninogenica. For Panels (B) and (C), Prev = P. melaninogenica. Error bars represent SD.
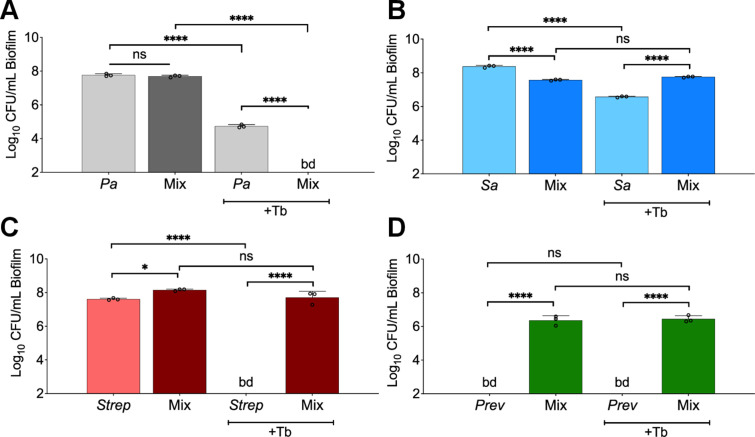
Figure 2—figure supplement 7. Polymicrobial context shifts tobramycin sensitivity of CF pathogens in fully anoxic conditions.

Figure 2—figure supplement 7.

Colony forming units of biofilm (B) populations of (A) P. aeruginosa (Pa), (B) S. aureus (Sa), (C) S. sanguinis (Strep), and (D) P. melaninogenica (Prev) grown as monocultures or mixed communities (Mix) and challenged or not with 100 µg/mL of tobramycin (+Tb) grown in an anoxic environmental chamber. Each data point presented in a column represents the average from three biological replicates each with three technical replicates (n=3). Statistical analysis was performed using ordinary one-way ANOVA and Tukey’s multiple comparisons posttest with *, p<0.05, ****, p<0.0001, ns = non-significant, and bd = below detection. Error bars represent SD.