. 2023 Jan 20;12:e81604. doi: 10.7554/eLife.81604

Figure 3. LasR loss-of-function drives biofilm-specific tobramycin tolerance in a mixed community.

Colony forming units of (A) P. aeruginosa strain PA14 (wild-type [WT]), isogenic ΔlasR mutant, and the complemented strain (ΔlasR::lasR), (B) planktonic and biofilm ΔlasR mutant cells, (C) LasR-defective (NC-AMT0101-1-1; LasR−) and LasR+ (NC-AMT0101-1-2) clinical isolates (CIs) and (D) P. aeruginosa quorum sensing regulator mutants grown as monocultures and mixed communities (Mix) and challenged or not with 100 µg/mL of tobramycin (+Tb). Each data point presented in a column represents the average from at least three technical replicates performed at least on three different days (n=3). Statistical analysis was done using ordinary one-way ANOVA and Tukey’s multiple comparisons posttest with **, p<0.01; ***, p<0.001; ****, p<0.0001. Error bars represent SD. bd = below detection and un = untreated.

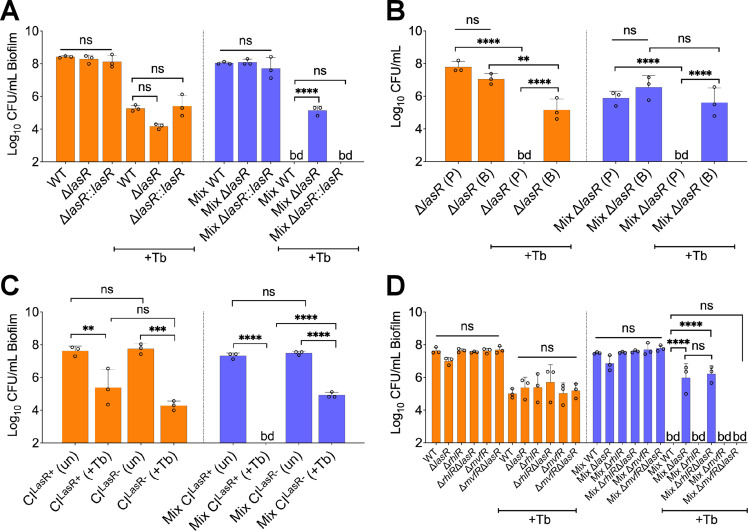
Figure 3.

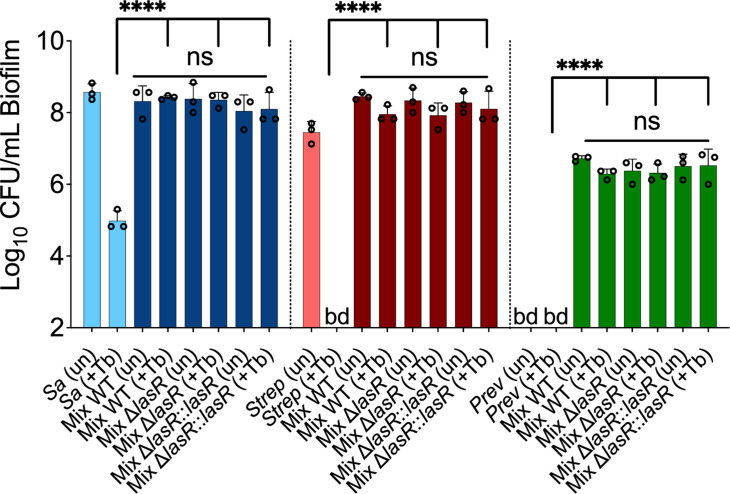
Figure 3—figure supplement 1. Loss of P. aeruginosa LasR function does not alter the viability of the other microbes in the mixed community compared to growth with wild-type (WT) P. aeruginosa.

Figure 3—figure supplement 1.

Colony forming units (CFUs) counts of S. aureus (Sa), S. sanguinis (Strep), and P. melaninogenica (Prev) grown as monoculture (light color) or mixed biofilm communities (dark color) with WT P. aeruginosa (WT) and associated mutants treated with tobramycin. Each data point presented in a column represents the average from at least three technical replicates performed at least on three different days (n=3). Statistical analysis was performed using ordinary one-way ANOVA and Tukey’s multiple comparisons posttest with ****, p<0.0001, ns = non-significant, bd = below detection, un = untreated, and +Tb = +100 µg/mL tobramycin. Error bars represent SD.
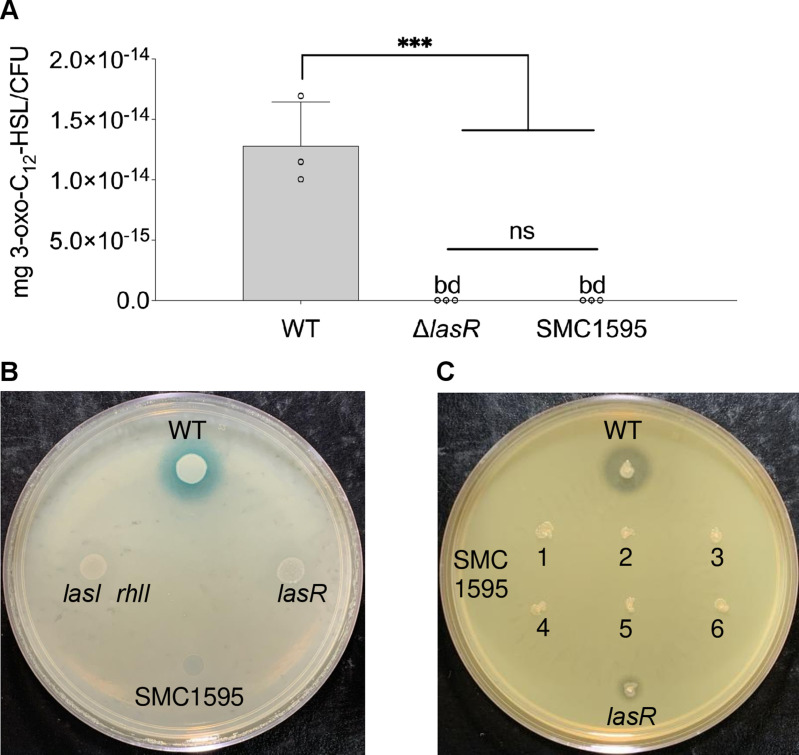
Figure 3—figure supplement 2. LasR-specific phenotypic tests of P. aeruginosa CF clinical isolate SMC1595.

Figure 3—figure supplement 2.

(A) Liquid chromatography tandem mass spectrometry (LC-MS/MS) quantification of the 3-oxo-C12-HSL signaling molecule. Each data point presented in a column represents the average from at least three technical replicates performed at least on three different days (n=3). Statistical analysis was performed using ordinary one-way ANOVA and Tukey’s multiple comparisons posttest with ***, p<0.001, ns = non-significant, and bd = below detection. (B) 3-oxo-C12-HSL-specific lacZ bioreporter assay. (C) Protease activity on milk plates. For the bioreporter assays, four SMC1595 clones were tested at least on four different days (n=4). For protease assays, six clones of SMC1595 were tested at least on three different days (n=3). Wild-type (WT) = P. aeruginosa PA14, ns = non-significant, and bd = below detection. Error bars represent SD.
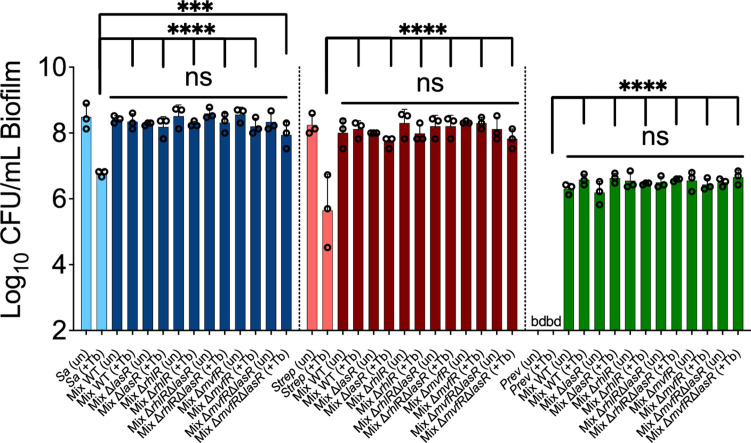
Figure 3—figure supplement 3. Tolerance of ΔlasR mutant in a mixed community: a role for the MvfR/PQS regulatory system.

Figure 3—figure supplement 3.

Colony forming unit (CFU) counts of S. aureus (Sa), S. sanguinis (Strep), and P. melaninogenica (Prev) grown as monoculture (light color) or mixed biofilm communities (dark color) with wild-type (WT) P. aeruginosa (WT) or the indicated mutants treated with tobramycin. Each data point presented in a column represents the average from at least three technical replicates performed at least on three different days (n=3). Statistical analysis was performed using ordinary one-way ANOVA and Tukey’s multiple comparisons posttest with **, p<0.001 and ****, p<0.0001; ns = non-significant, bd = below detection, un = untreated, and +Tb = +100 µg/mL tobramycin. Error bars represent SD.