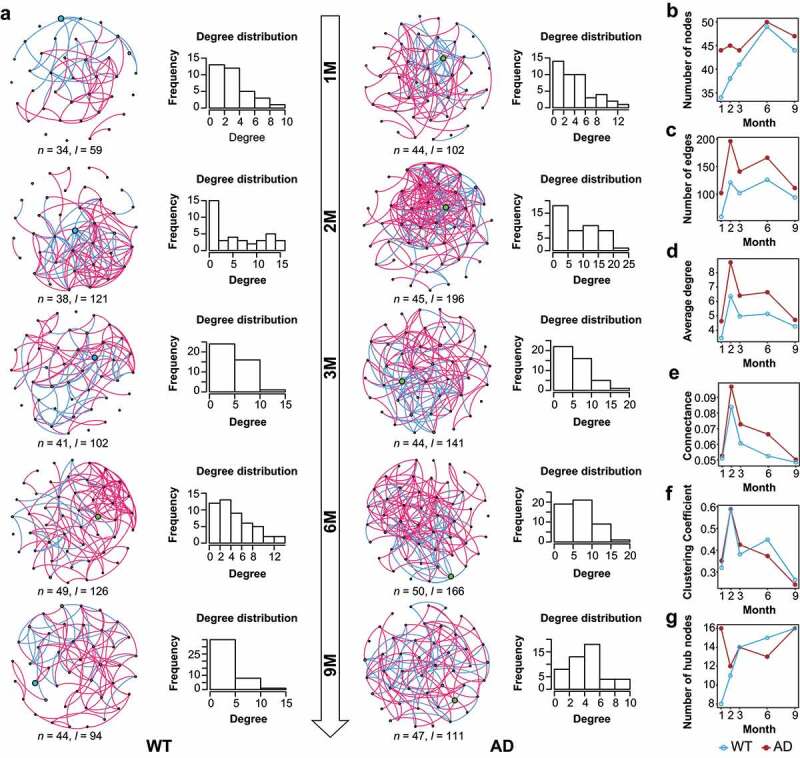
Figure 2.

Dynamic changes of the gut microbiota co-occurrence networks in Alzheimer’s disease and wild-type mice. (a) Gut microbiota (GM) co-occurrence networks with respect to mouse age in the Alzheimer’s disease (AD) and wild-type (WT) mice. In the networks, each node indicates a genus, and its size indicates relative abundance. Pink and green edges indicate positive and negative correlations, respectively. Histograms show the degree distributions of nodes of the networks. (b–g) Topological features of GM co-occurrence networks in the mice, including the dynamic changes of nodes (b), edges (c), average degree (d), clustering coefficient (e), connectance (f), and hub nodes (g). The WT and AD groups are indicated by blue and red, respectively.
