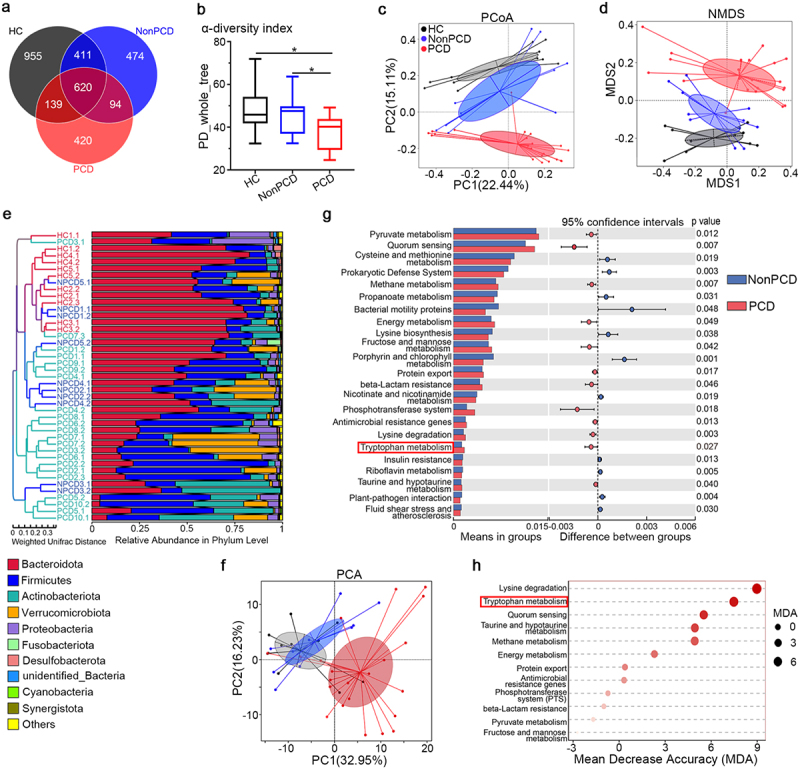
Figure 2.

Tryptophan metabolism in bacterial predicted functions was enriched in PCD. (a) Overlaying Venn diagram indicating fewest operational taxonomic units (OTU) of gut microbiota in PCD mice, compared to HC and NonPCD mice. (b) Attenuated bacterial richness and evenness by reduced α-diversity (PD-whole-tree) in PCD mice, n = 11 for HC, n = 10 for NonPCD and n = 22 for PCD mice. Data are presented in Box plot as Mix to Max. * p < .05. (c) Microbial distributions by NMDS plot with cluster in mice among three groups. (d) Differences of microbial structure by PCoA plot with cluster in three grouped mice. (e) Unweighted pair-group method with arithmetic means (UPGMA) tree based on weighted unifrac distance showing microbial differences among each individual mice (left panel) and relative abundance of top 10 bacteria in phylum level (right panel). (f) Principal coordinate analysis (PCA) showing difference of bacterial predicted functions in level 3 by PICRUSt among three groups. (g) Histograph of bacterial predicted functions in level 3 of KEGG pathway analyzed by Tax4Fun showing differentially abundant functions with significance between NonPCD and PCD mice. (h) Ranking of microbial predicted functions in KEGG pathway enriched in PCD mice according to their mean decrease accuracy (MDA) in unsupervised RandomForest analysis.
