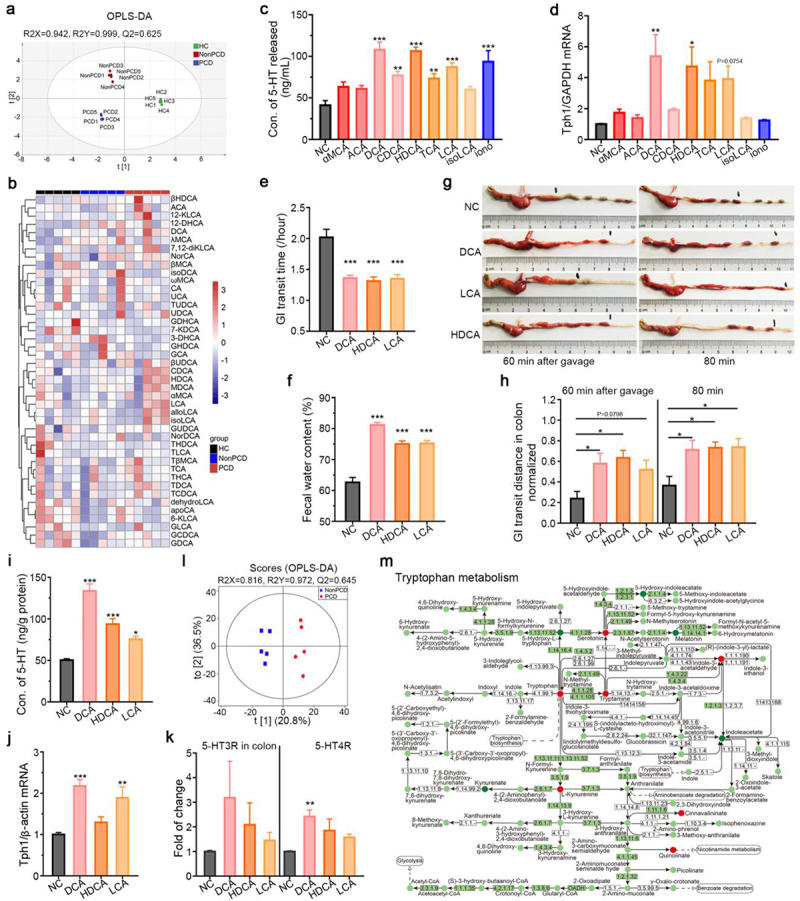
Figure 6.

Overproduction of 5-HT induced by microbial bile acid metabolites. (a) Distinction in fecal bile acid metabolism by the Orthogonal Projections to Latent Structures Discriminant Analysis (OPLS-DA) model among three grouped mice, n = 5. (b) Heatmap showing difference of 43 individual BAs in the feces of three grouped humanized gut microbiota mice. (c) Level of 5-HT in RIN-14B cell supernatant when exposed to bile acids metabolites: α-muricholic acid (50 μM), Allocholic acid (50 μM), deoxycholic acid (25 μM), chenodeoxycholic acid (50 μM), hyodeoxycholic acid (250 μM), taurocholic acid (250 μM), lithocholic acid (50 μM), isolithocholic acid (50 μM), n = 3–8. (d) Relative expression of TPH1/ GAPDH in RIN-14B cells when exposed to these BAs metabolites, n = 3–6. (e) Secondary bile acids (DCA, HDCA and LCA) expedite GI transit in vivo, n = 10–12. (f) Fecal water content in mice treated with these secondary BAs (DCA, HDCA and LCA), n = 10–12. (g) Representative photographs showing the in vivo pro-motility effects of these BAs. (h) Extended normalized peristalsis distance in colon by these BAs 60 min and 80 min after carmine solution gavage, n = 5–6. (i) Concentration of colonic 5-HT in mice treated with these BAs, n = 9–11. (j) Relative expression of TPH1 to β-actin in colon of mice treated with these BAs, n = 5. (k) Elevated expressions of 5-HT receptors to β-actin in colon of BAs-treated mice, n = 5. (l) OPLS-DA plot revealing discrimination of fecal tryptophan metabolism between NonPCD and PCD patients, n = 5. (m) KEGG pathway map showing differential metabolites of tryptophan metabolism in feces of NonPCD and PCD patients, red circles denoted upregulated metabolites and green circles downregulated. Data are displayed as mean ± SEM; NC normal control; * p < .05, **p < .01, ***p < .005.
