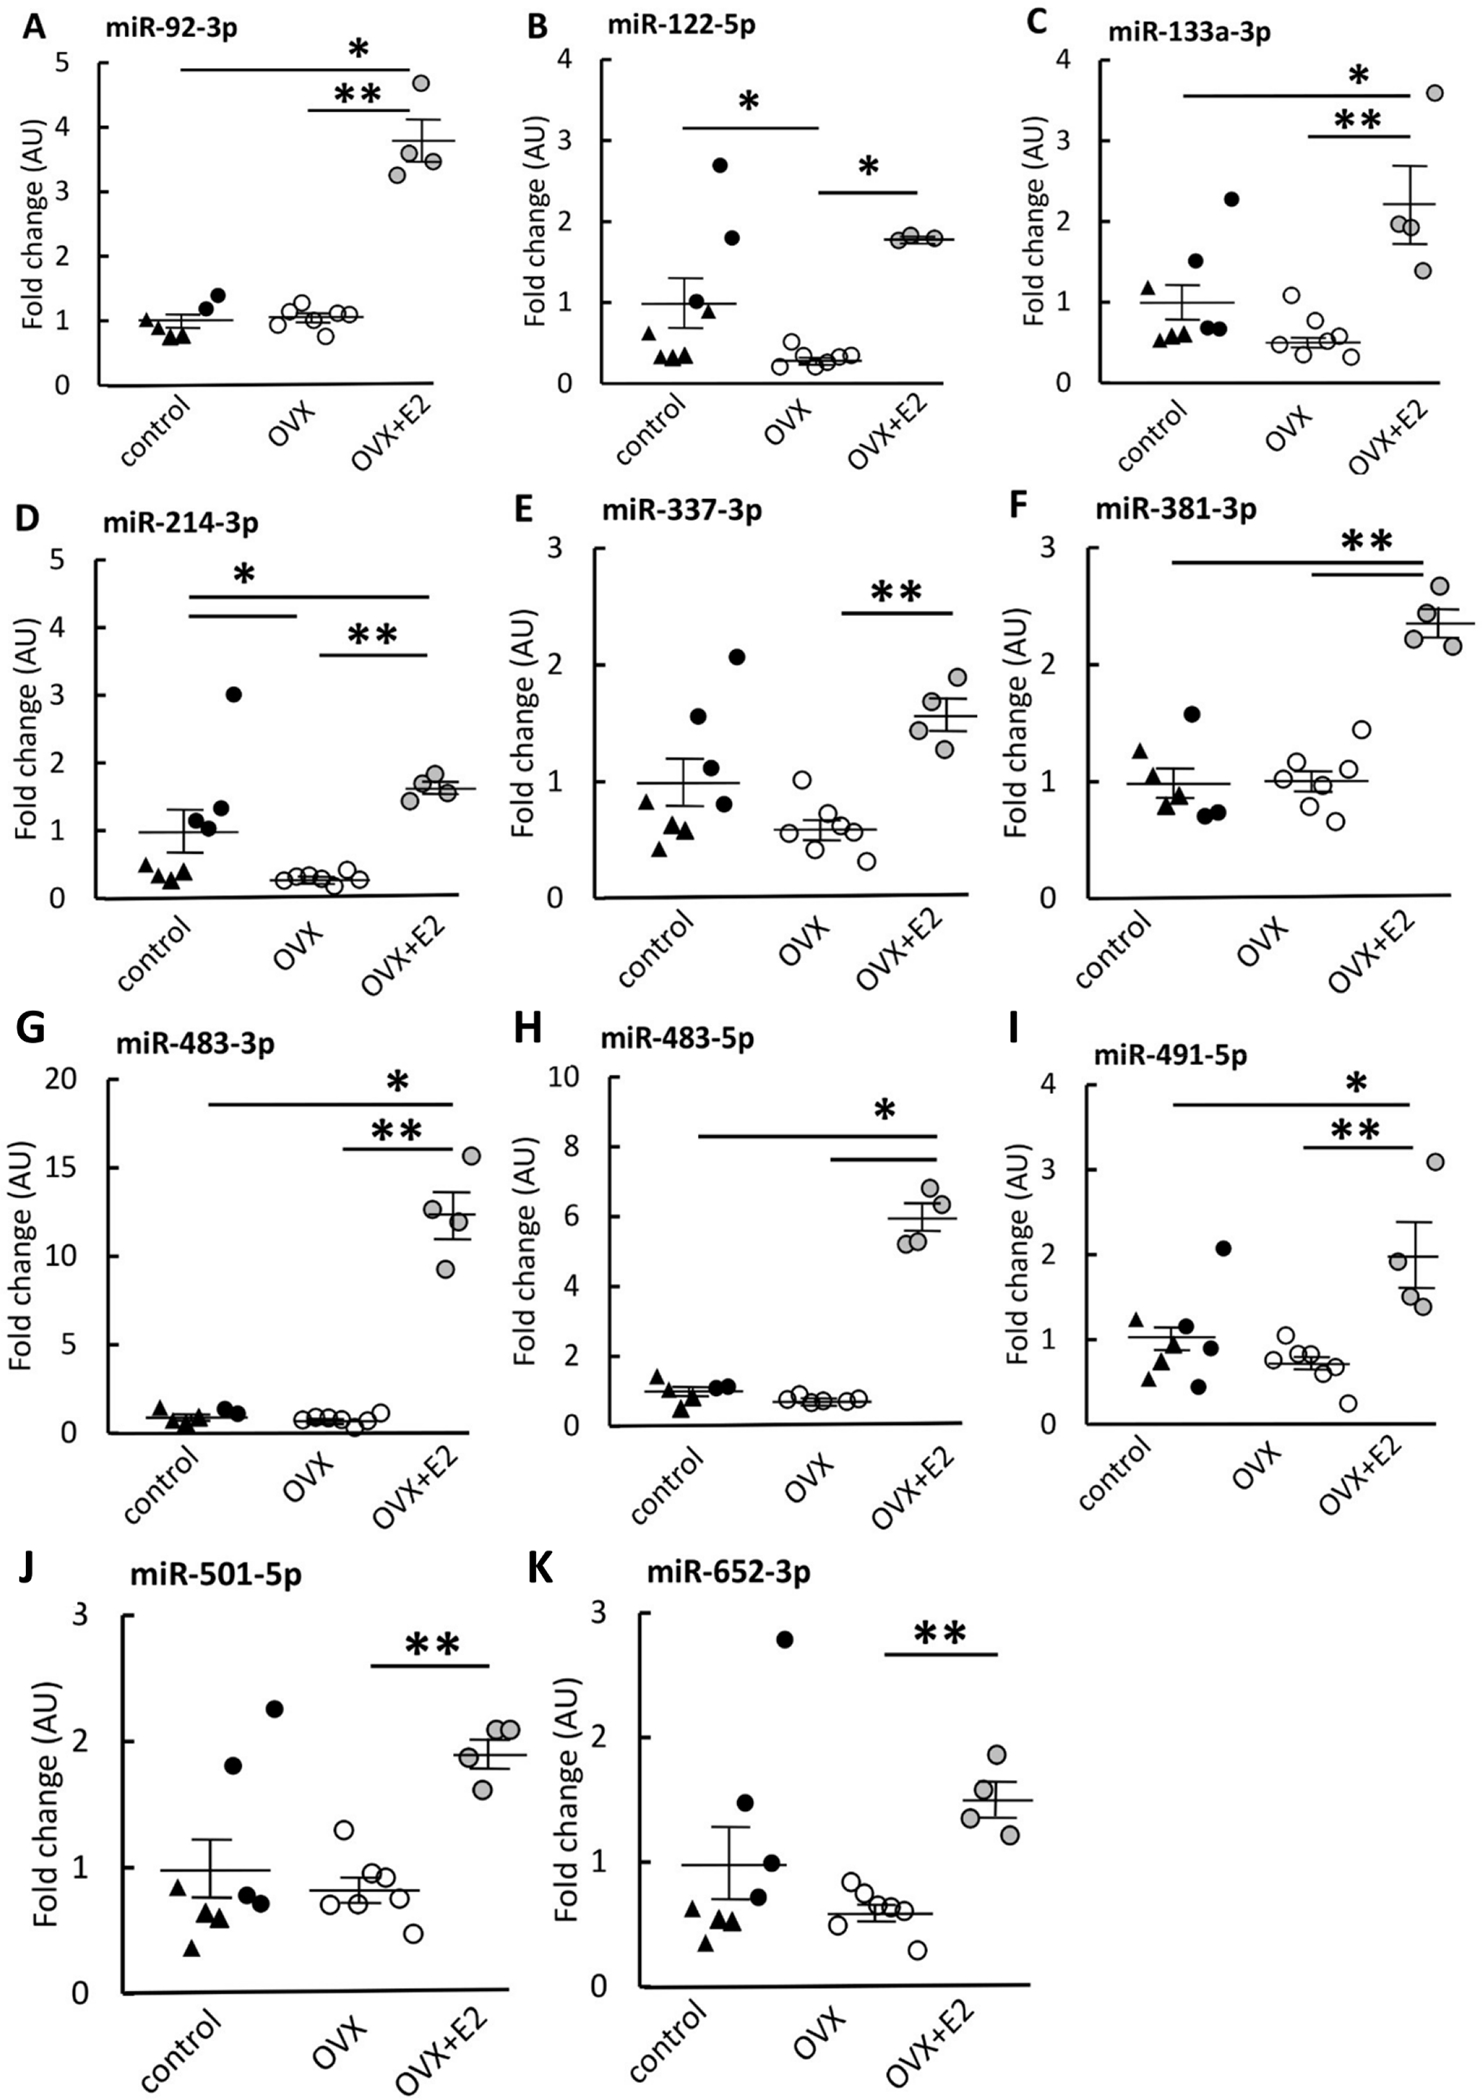
FIGURE 2. miR expression in skeletal muscle measured by qPCR.

OVX mice had lower expressions of all of the studied miRs compared with OVX+E2 group (A-K). OVX mice had also lower miR-122-5p and miR-214-3p expression compared with control (B, D). Compared with control, OVX+E2 group had higher expression of miRs 92a-3p, 133a-3p, 214-3p, -381, 483-3p, 483-5p and 491-5p - (A, C, D, F, G, H, I). The control group is comprised of ovary-intact mice with triangles representing mice that did not undergo any surgery and black dots representing sham-operated mice. Results are expressed as mean + SEM. *p<0.050, **p<0.010.
