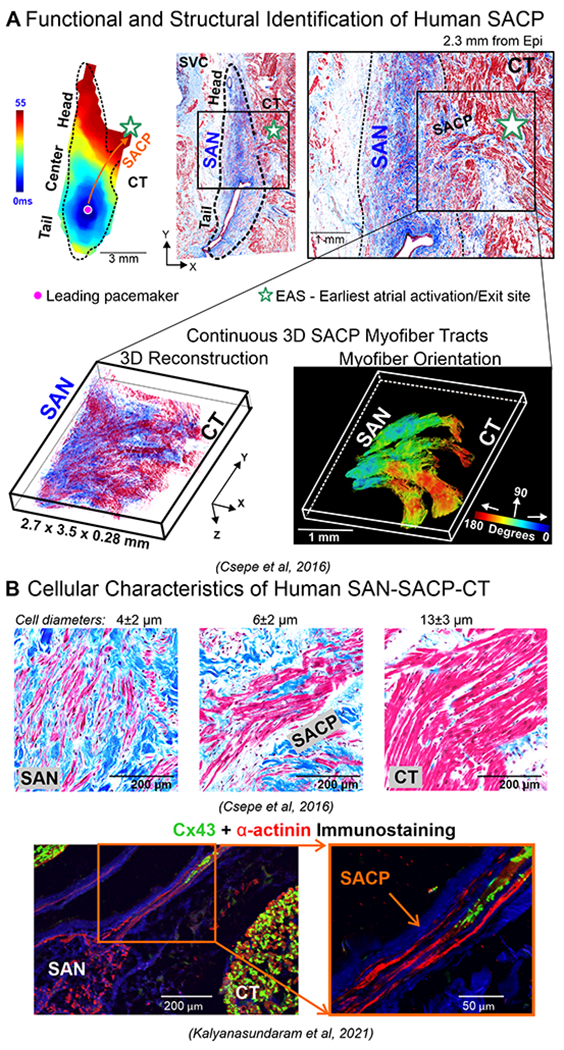
Figure 3.

A. Top left, schematic of human SAN showing SACPs; Middle, near-infrared optical mapping revealed conduction within the SAN complex; Right, histology section of the same lateral region shows the SACP region. Bottom, 3D reconstruction of serial histological sections and computational myofiber tracking of the SACP region containing continuous myofiber tracts between the SAN and atria. B. Top panels, high resolution histological images. Bottom panels, immunostaining images of Cx43 and α-actinin in SACPs. (Modified from2,5,60).
