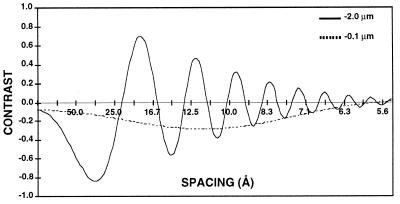
FIG. 8.
The CTF for a Philips CM200 FEG at 200 kV is plotted as a function of resolution in angstroms for an underfocus of 2 μm and an underfocus of 1,000 Å and a magnification of ×36,000. The decrease in the amplitude of the function with increased resolution reflects the measured attenuation due to the lack of coherence in the source, specimen movement, and other optical effects. The value of −0.1 at the origin is the amplitude contrast portion of the function.

